Benchmark Results — Intel i7-12700K
Full benchmark results for the i7-12700K system described on the
benchmark systems page, measured on the same quiet machine under
the pinning policy documented there.
Provenance. Several measurement dates, and which one applies depends on the section:
| Section | Measured | Why |
|---|---|---|
| Platform benchmark (#737) | 2026-11-11 and 2026-11-12 | The #737 session pair of the platform benchmark (#721); a different benchmark from every section below it |
| Threading measurements | 2026-10-25 (published) | #636 and #640, published with #645 and #647 |
| GEMM scaling | 2026-08-05 (second pass) | Re-taken again after #410 fixed the scaling regression #382 introduced |
| Dense BLAS sweep | 2026-08-05 | Re-taken after the register-tile change (#382) |
| LAPACK sweep, sparse scoreboards | 2026-08-01 | #382 is gated behind MTL5_NATIVE_FAST_GEMM; these are the generic native build and vendors, so it cannot reach them |
| #297 kernel families | 2026-08-03 | Re-taken after the parallel B-pack change (#348) |
The single-threaded BLAS sweep is deliberately not re-taken in the second
pass: balanced_mc only engages when ic_nt > 1, so #410 cannot reach the
serial path. That gives the second pass a built-in control — native-fast’s
T = 1 scaling figure moved 67.81 → 68.82 GFLOP/s at N = 2048, inside the ~4%
session band, which is what “the serial path is untouched” should look like.
The 2026-08-05 pass re-ran all five backends in one session, not just
native-fast. The headline claim is a ratio of native-fast to OpenBLAS, and a
ratio is only defensible when both sides come from the same session on the same
idle machine. That the three untouched backends (native, openblas, blis)
moved within noise while native-fast moved sharply is itself the evidence that
the change is real and attributable — see the GEMM table.
Two prior findings are retracted below rather than quietly overwritten: the “MKL is weak at small N” claim did not reproduce, and native-fast is no longer the best multi-core scaler. Both are marked in place.
One caveat on reading the single-thread column: the T = 1 GEMM figure varies
by a few percent between sessions. It was measured at 57.83 and 57.30 GFLOP/s
during the #348 verification runs and at 55.46 in the 2026-08-03 sweep, all at
N = 2048, one P-core, same protocol — a ~4% spread. The 2026-08-05 value is
67.81, which is far outside that band and is the #382 effect, not drift.
Read this page together with the system description. These are reference numbers for one desktop hybrid CPU, not a portable performance claim.
Headline findings
Section titled “Headline findings”-
The platform benchmark of 2026-11 agrees (#737). Its 512³ GEMM puts native-fast at 98% of OpenBLAS on one core, so the parity below reproduces in a second benchmark. At eight threads and 512³, native-fast reaches 47% of OpenBLAS in f64. See Platform benchmark (#737).
-
native-fast GEMM is at ~97% of OpenBLAS single-threaded for N ≥ 256 (median 97.4%, range 95.5–98.8%), so the #82 gate passes with a wide margin.
This is a change in standing, not just a number. Before #382 the figure was 82.3% (range 76.3–86.5%), which the epic described as “inside the 10–20% target”. At 97.4% the single-core kernel is at parity with OpenBLAS — within 2.6% — so the gap #82 was opened to close has essentially closed for this operation on this machine. The per-size spread also tightened from ~10 points to ~3, meaning the median is now reproducible for a second reason: the sizes agree with each other.
-
The generic C++ path is ~16× slower than native-fast on GEMM (4.5 vs 70 GFLOP/s at N = 1025). The SIMD/blocked path is what makes MTL5 competitive at all, and #382 widened this gap rather than narrowing it.
-
Multi-core GEMM throughput is the highest measured on this machine — 470.9 GFLOP/s at N = 2048 on 8 P-cores, against 429.4 before #410 and 401.8 before #382. But native-fast is still the worst scaler of the four, at 6.84× / 85.5% efficiency against BLIS 7.39×, OpenBLAS 7.25× and MKL 7.17×.
Two corrections, in opposite directions. This page once reported native-fast as the best scaler (7.24× / 90.5%); #382 broke that, and the previous revision recorded it as the worst at 6.33× / 79.2% with an outright −7.4% regression at N = 1024. #410 fixed the cause — see what #382 and #410 did to scaling — and the N = 1024 regression is gone (+22% against #382). But efficiency is 85.5%, not the 90.5% of the pre-#382 era, and still last of four. So the “worst scaler” finding stands, softened; only the regression is retracted. Part of the remaining gap is arithmetic rather than a defect: efficiency is measured against a
T = 1baseline that #382 raised 22%, so the same parallel machinery divides into a lower number. -
Native LAPACK is an order of magnitude behind vendors — 1.2–6.7 GFLOP/s vs 50–60. The factorizations do not have a tuned path.
-
Sparse triangular solves do not scale, in any structure. This reproduces the finding already recorded in the #297 results.
-
Native sparse LU trails SuperLU by 2–18×, and the largest gaps are on the matrices where native produces more fill than SuperLU — the supernodal kernel-class gap the epic predicts.
Platform benchmark (#737)
Section titled “Platform benchmark (#737)”Measured on 2026-11-11 and 2026-11-12. This section reads the capability card
of the #737 pair’s second session, 20261112T004852Z
(raw data and per-run cards).
The published card has since moved to a later session, so
its figures differ from the ones quoted here. The card is mtl5_bench, the
platform benchmark of #721, which runs every operation family at fixed sizes
and reports each against the machine’s measured FMA peak and bandwidth. It is a different benchmark from
the sweeps in the sections below. Their sizes and protocols differ, so compare
the two only through ratios taken within one benchmark.
| Sessions | 20261111T190041Z and 20261112T004852Z, a cold boot between them. The card now shows a later pair, 20261113T055208Z and 20261113T060838Z (#810), whose direct-solver entries their own page reads |
| Commit | bfa1c2822688 |
| Compiler | GCC 15.2.0, -O3 -DNDEBUG, MTL5_NATIVE_ARCH=ON. Highway’s target is AVX2 |
| Cores | the 8 P-cores, one thread per physical core: CPUs 0, 2, 4, …, 14 |
| Clock policy | governor performance on the P-cores, turbo on |
| Runs | native, native-fast and blas (OpenBLAS), each at 1 and 8 threads, class medium. 0 failed checks |
| Repeatability | 608 of 666 entries (91.3%) within ±5% between the two sessions |
Repeatability. The median ratio between the sessions is 0.996–1.002 in
every run. The largest outliers are the single-thread dense eigensolvers
(schur, eigen_symmetric, eigenvalue, sylvester), 1.5–1.8× slower in
the second session. A crash-looping microk8s pod restarted a container about
every 13 s during both sessions, so it adds background load to both rather
than biasing one.
The #737 card by area
Section titled “The #737 card by area”The median %roof of each area. Areas without a roofline are left out.
| area | native 1T | native 8T | native-fast 1T | native-fast 8T | blas 1T | blas 8T |
|---|---|---|---|---|---|---|
| blas1 | 44% | 83% | 89% | 87% | 44% | 84% |
| blas2 | 78% | 41% | 91% | 47% | 96% | 118% |
| blas3 | 17% | 2% | 65% | 12% | 81% | 66% |
| factor | 8% | 1% | 8% | 1% | 19% | 5% |
| eigen | 4% | 1% | 4% | 1% | 24% | 3% |
| elementwise | 8% | 4% | 7% | 4% | 8% | 4% |
| sparse | 48% | 36% | 52% | 36% | 48% | 36% |
| direct | 1% | 0% | 1% | 0% | 1% | 0% |
| smoother | 62% | 29% | 54% | 27% | 62% | 29% |
| mg | 56% | 25% | 49% | 23% | 56% | 25% |
| mixed | 35% | 16% | 85% | 49% | 35% | 17% |
A %roof above 100% means the entry moved its bytes faster than the bandwidth
probe did. OpenBLAS’s 8-thread blas2 is the clearest case, and that session’s
card marks its most extreme entry, f32 trmv at 201%, as a suspect model. Read these
entries as “at the memory roof”.
Roofline
Section titled “Roofline”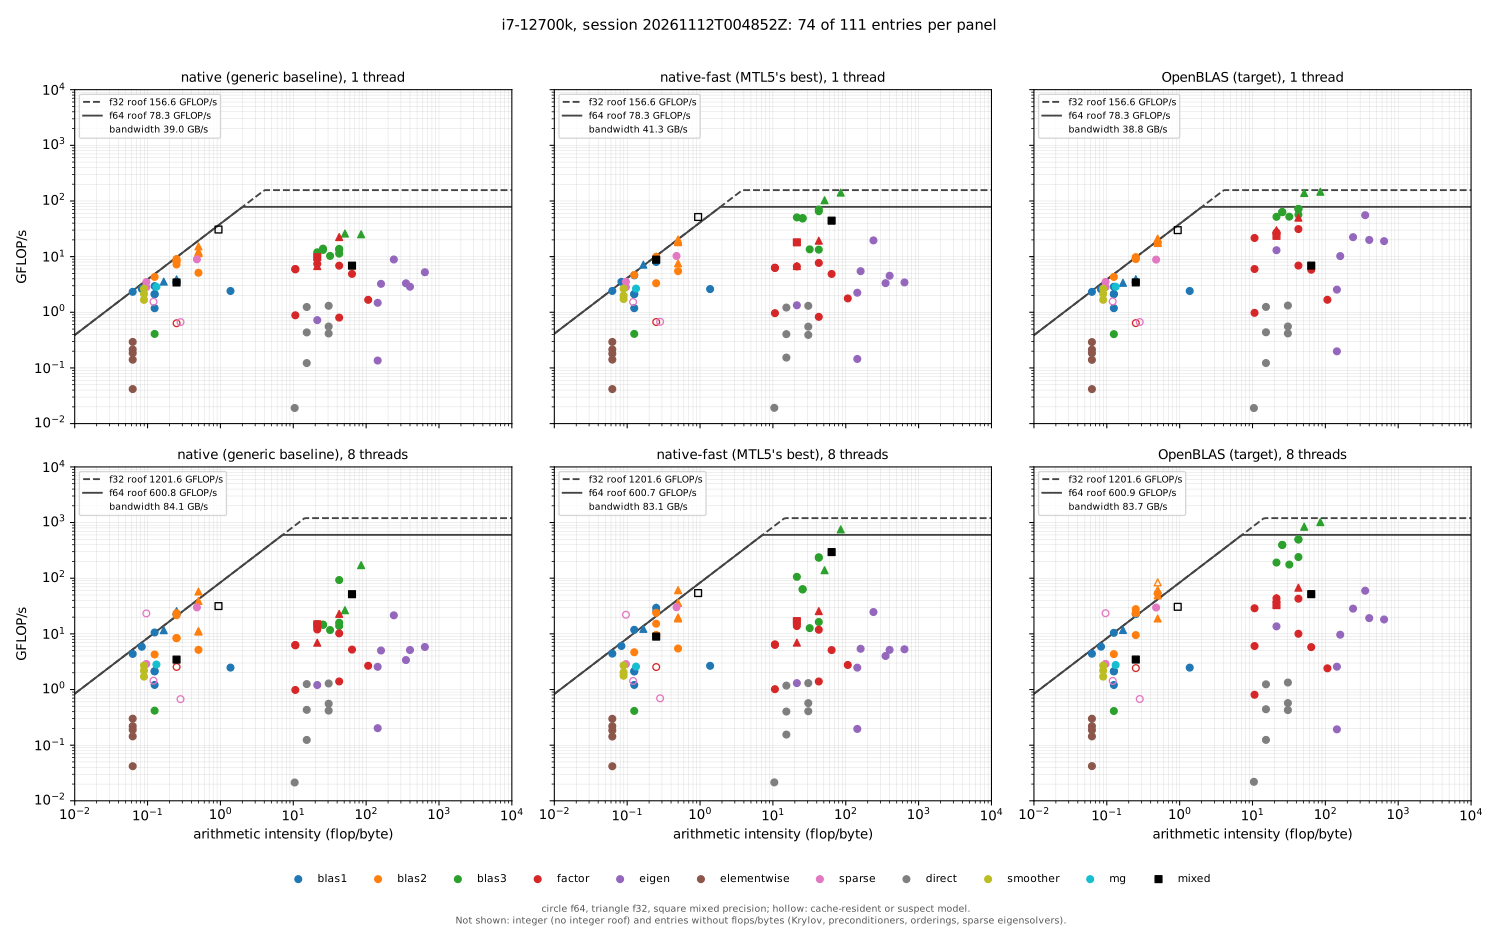
Each panel places one build’s entries at their arithmetic intensity (flops per
byte moved) and their measured GFLOP/s. The rows are 1 thread and all 8
threads. The columns are the generic native build, the baseline a
straightforward implementation gives; native-fast, the best MTL5 does; and
the blas build, where OpenBLAS and its LAPACK take the dense kernels: what
tuned libraries reach, and so MTL5’s target. The lines are each run’s own
roofs: the measured bandwidth up to the ridge, then the FMA peak, solid for
f64 and dashed for f32. An entry at 100% of its roof sits on the line. Integer
entries are left out, because the model has no integer ceiling, and so are the
28 entries that record no flops or bytes (Krylov solvers, preconditioners,
orderings and sparse eigensolvers). That leaves 74 of the 111 entries in each
panel.
Across the columns:
- Level 3 is where the builds separate. On one core GEMM is at 17%, 90% and 92% of the FMA peak: native-fast closes almost the whole gap to OpenBLAS. On eight threads it is at 15%, 39% and 83% in f64 (14%, 63% and 85% in f32), so the gap that remains is in the threading.
- The factorizations and eigensolvers rise only in the OpenBLAS column,
where LAPACK takes them. The
factormedian is 8% in both MTL5 builds and 19% with OpenBLAS; LU f64 is at 9% against 35%. Theeigenmedian is 4% against 24%. - native-fast leads on the memory-bound kernels on one core.
blas1is at a median 89% of its roof, against 44% for both the generic build and OpenBLAS. On eight threads all three are at 83–87%. - The elementwise kernels and the sparse direct solvers don’t move between columns, because no build replaces them.
Within the native-fast column:
- The memory-bound points line up along the slope. On one core
blas1andblas2are at a median 89% and 91% of their roof. The hollow points fit in the 25 MiB L3, so the DRAM slope doesn’t bound them. - A few memory-bound points sit slightly above the slope. The slope is the
best of three bandwidth probes (triad, read and update), not a hard limit,
and a kernel with a lighter read/write mix can beat it. At eight threads
dot,two_normandgemvreach 114–147%.spmvat 276% is flagged as a suspect model (hollow). - GEMM reaches the ceiling on one core: 90% of the FMA peak in f64 and
f32. At eight threads the ceiling is 600 GFLOP/s in f64, and GEMM at 512³
reaches 39% of it (f32, 63%). Level 3 as a whole is at a median 12%: the
mediumsizes are small for eight cores. - Points far under the slope at an intensity near 0.06 are the elementwise
transcendentals (
sin,erf,log,exp,sqrt). The model counts one flop per element, but each costs tens of instructions, so they are compute- bound in fact and sit 9–60× under the slope on one core. - The compute-bound points other than level 3 sit far under the ceiling: at most a third of it, and the sparse direct solvers under 4%. These are the factorizations at 512×512, the dense eigensolvers at 256×256 and the sparse direct solvers. Their flop counts are nominal, and most of their time goes to panels, pivoting, iteration and indirect access, not to FMAs at full width.
GEMM at 512³
Section titled “GEMM at 512³”blas3/gemm, GFLOP/s and % of the measured FMA peak (78.3 GFLOP/s per P-core
in f64, 601 on eight).
| native | native-fast | OpenBLAS | native-fast / OpenBLAS | |
|---|---|---|---|---|
| f64, 1 thread | 13.33 (17%) | 70.28 (90%) | 71.87 (92%) | 98% |
| f64, 8 threads | 92.66 (15%) | 233.83 (39%) | 497.69 (83%) | 47% |
| f32, 1 thread | 25.23 (16%) | 141.61 (90%) | 146.71 (94%) | 97% |
| f32, 8 threads | 171.74 (14%) | 753.52 (63%) | 1019.10 (85%) | 74% |
- The single-core parity reproduces. The sweep below put native-fast at 97.4% of OpenBLAS (the median for N ≥ 256). That session’s 512³ entry gives 98% in f64 and 97% in f32, with a different benchmark and harness.
- At 512³, eight threads scale native-fast only 3.3× in f64 (5.3× in f32), against 6.9× for OpenBLAS. The scaling study measured 6.84× at N = 2048. A 512³ problem split eight ways is small: OpenBLAS keeps 83% of the peak on it, native-fast 39%.
- Factorizations and eigensolvers are still where the gap is.
factor/luf64 512×512 reaches 6.67 GFLOP/s in native-fast against 27.17 for OpenBLAS’s LAPACK. Theeigenarea is at 4% against 24%. The LAPACK sweep found the same. - Mixed precision is native-fast’s.
mixed/gemm(f32 inputs, f64 accumulation) reaches 44.3 GFLOP/s on one core against 6.9 in the other two builds.
Interleave width
Section titled “Interleave width”From Interleave width across the benchmark machines,
taken in the same sessions on CPU 0. Under GCC, f64 gemv, trmv and forward
substitution are fastest at W = 12, and f32 at W = 6 or 8. Under Clang, f64 is
fastest at 8 and f32 at 6. The x86-64 default of #798, W = 8, costs at most
2.9% under GCC and 10% under Clang (f32 gemv).
Column-major gemv in native-fast (#804, fixed)
Section titled “Column-major gemv in native-fast (#804, fixed)”In these sessions, column-major gemv in native-fast takes 10.07 ms on one core
against 4.64 ms in the generic build and 3.60 ms in OpenBLAS: 2.2× slower than
the generic build. The same gap appeared on every machine of the campaign.
The cause was the kernel’s traversal. It held a 16-row strip of y in registers
and swept all n columns for it, so every load touched a different page. #809
replaced it with a sweep of 64 KB strips of y down the columns, four columns
per pass where the build has FMA. In an A/B run on this machine (one core,
n = 4096) column-major gemv went from 9.66 to 3.45 ms in f64 and from 4.27 to
1.69 ms in f32, against 4.76 and 2.29 ms in the generic build. The first
sessions on this machine after #809, the #810 pair of 2026-11-13, agree: one
core, f64 3.45 ms in native-fast against 4.70 ms generic and 3.61 ms in
OpenBLAS; f32 1.68 against 2.19 and 1.64 ms.
Dense BLAS (single-threaded)
Section titled “Dense BLAS (single-threaded)”Sweep 65:1025:80 — deliberately odd, non-power-of-2 sizes — pinned to one
P-core, every vendor’s threading forced to 1.
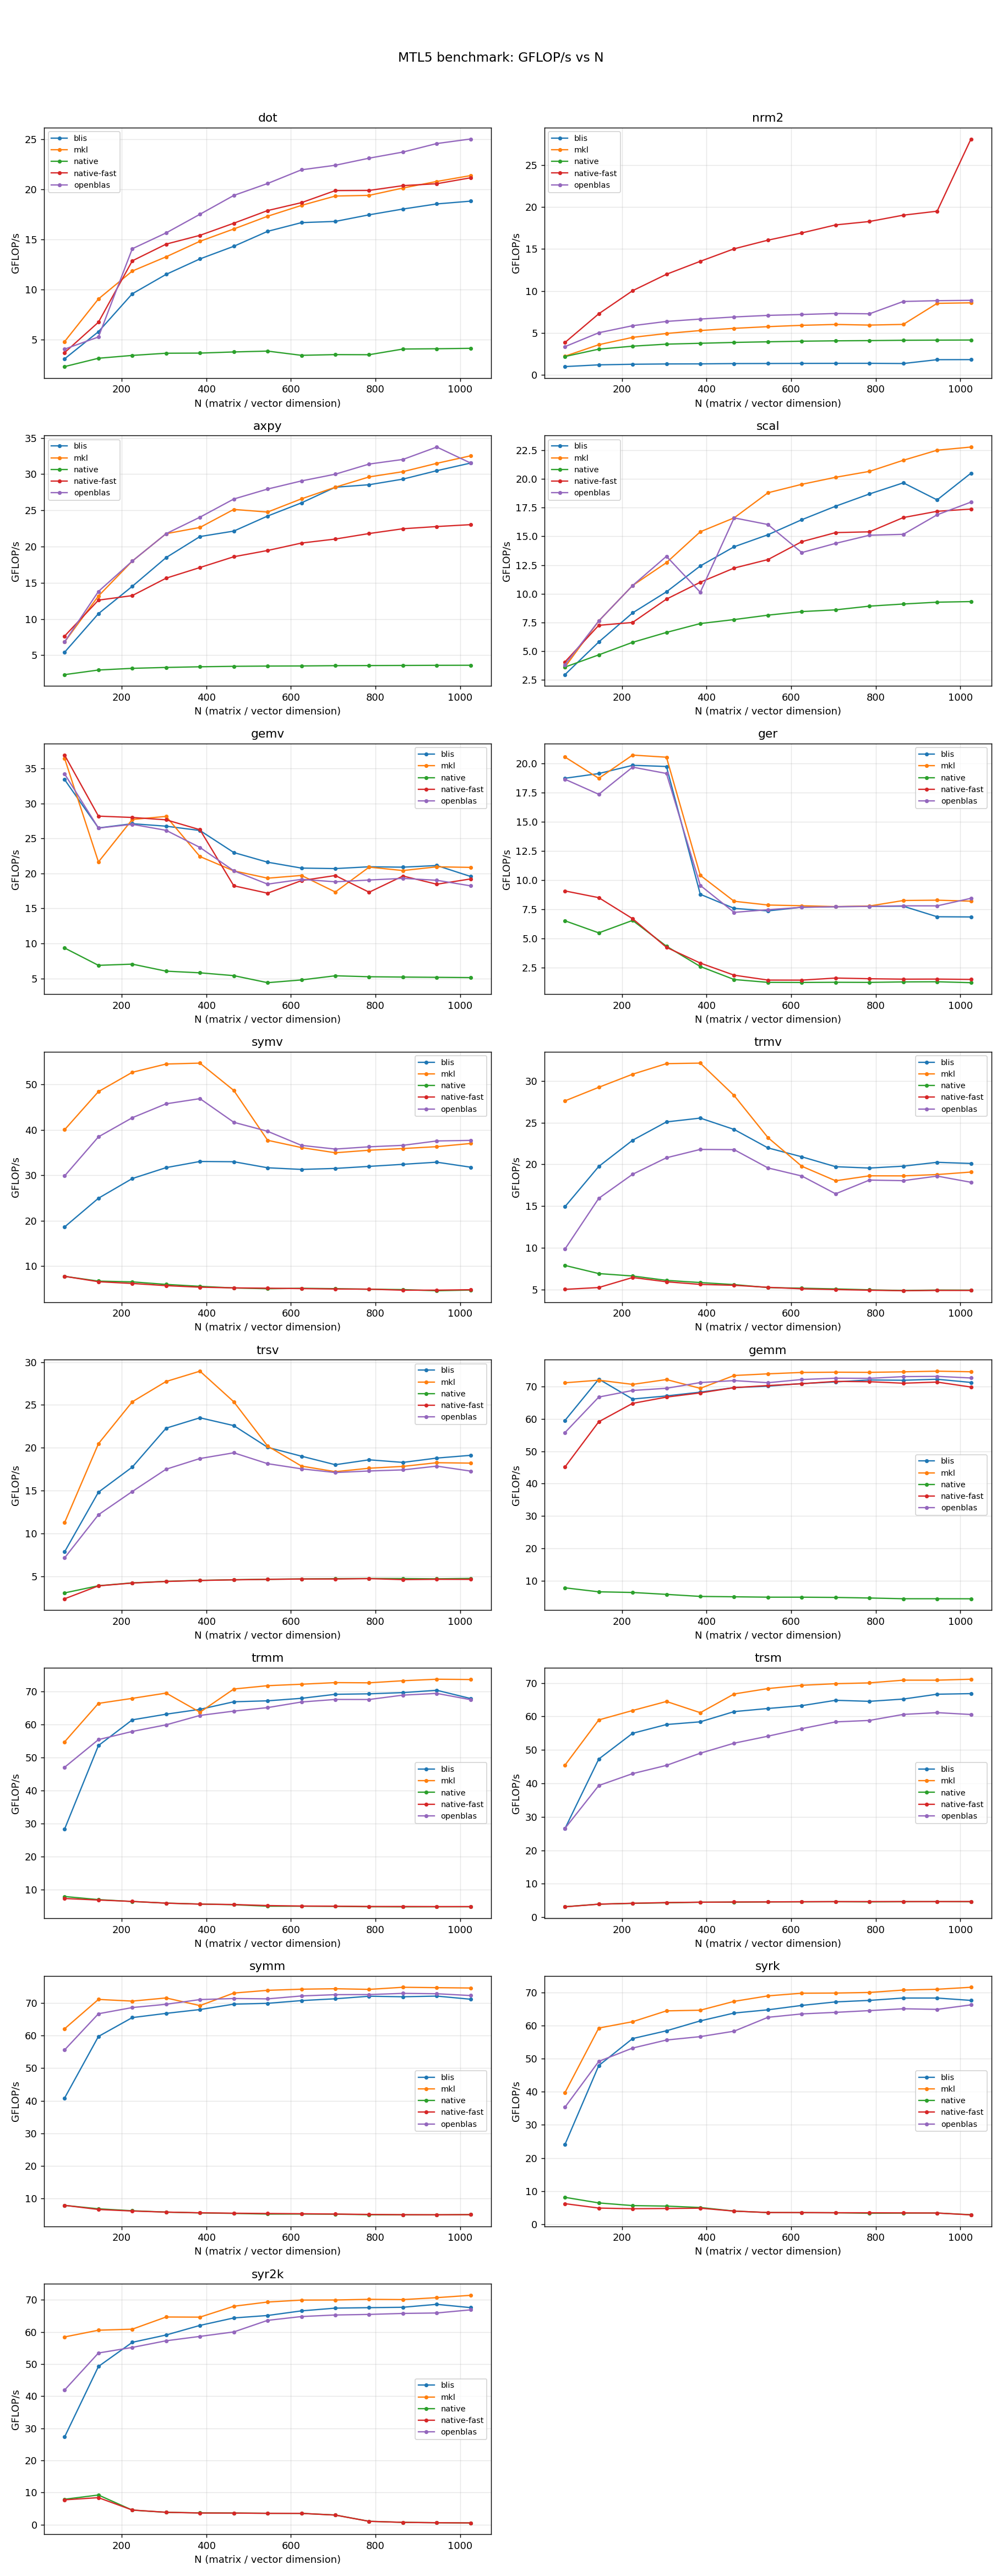
GEMM, GFLOP/s
Section titled “GEMM, GFLOP/s”| N | native | native-fast | blis | openblas | mkl |
|---|---|---|---|---|---|
| 65 | 7.87 | 45.12 | 59.48 | 55.75 | 71.12 |
| 145 | 6.64 | 59.10 | 72.25 | 66.71 | 71.92 |
| 305 | 5.85 | 66.70 | 67.06 | 69.42 | 72.11 |
| 465 | 5.10 | 69.63 | 69.63 | 71.79 | 73.36 |
| 705 | 4.90 | 71.55 | 71.39 | 72.53 | 74.39 |
| 1025 | 4.49 | 69.81 | 71.23 | 72.60 | 74.51 |
The attribution is in the columns that did not move. All five backends were
re-measured in the same session; against the 2026-08-03 data, native moved
+0.3/−0.1, openblas −0.1/+0.2 and blis −0.5/+0.6 GFLOP/s at N = 65/1025 —
noise. native-fast moved +4.2 and +10.4 (59.44 → 69.81, +17.4%). A
change confined to the one backend #382 touched, in a session where the other
three held still, is the change being real rather than the machine being
different.
Three things stand out:
The generic path is not competitive, and is not meant to be. native sits
flat at ~5 GFLOP/s and declines with N as it falls out of cache — now roughly
16× below native-fast at N = 1025, up from 12× before #382. This is the portable
fallback; the SIMD blocked GEMM is what closes the gap.
RETRACTED — “MKL is remarkably weak at small N”. This page previously reported MKL at 17.5 GFLOP/s at N = 65 and 20.5 at N = 145, attributing it to dispatch and threading setup cost. That does not reproduce. MKL now measures 71.1 and 71.9 at those sizes — flat from N = 65 rather than ramping to full speed by N ≈ 305.
What is established:
- The new figure is stable across four independent measurements at N = 65: 71.1 (sweep), 68.6 and 71.4 (standalone re-runs), 60.8 (cold-core run below).
- MKL’s version is unchanged — oneAPI MKL 2026.1, installed 2026-07-07, before both measurement dates.
- MKL’s large-N figures are identical across the two sessions (74.59 → 74.51 at N = 1025), so this is not general machine state.
- In the old data the effect had the shape of a partial warm-up: at N = 65 min ≈ median (uniformly slow), but at N = 225 the min/median spread was 35%, and by N = 305 old and new agree to 0.3%.
The obvious explanation — a cold P-core still at its 800 MHz idle clock, since the whole N = 65 measurement is only ~0.3 ms of work — was tested and refuted: forcing the core fully idle first gives 60.8 GFLOP/s at 800 MHz against 61.0 immediately after a sustained warm-up at 4849 MHz. The core ramps inside the harness’s own warm-up.
The cause is undetermined. The old figures are treated as an unreproducible measurement rather than a property of MKL, and no replacement explanation is offered here because none survived testing.
BLIS is no longer the small-N leader — that ranking followed from the MKL figures above. BLIS stays within ~3% of OpenBLAS across the range, which still makes it a reasonable small-matrix reference.
Epic #82 acceptance gate — PASSING at 97.4%
Section titled “Epic #82 acceptance gate — PASSING at 97.4%”The gate asks whether MTL5’s own kernels land within 10–20% of OpenBLAS for GEMM at N ≥ 256. Against the 2026-08-05 data:
benchmarks/analyze_gate.py data/blas_sweep_native-fast.csv \    data/blas_sweep_openblas.csv --gate --op gemm --threshold 0.80 --min-size 256
  N=  305  native-fast=   66.70  openblas=   69.42   96.1%  [ok]  N=  385  native-fast=   68.00  openblas=   71.19   95.5%  [ok]  N=  465  native-fast=   69.63  openblas=   71.79   97.0%  [ok]  N=  545  native-fast=   70.27  openblas=   71.14   98.8%  [ok]  N=  625  native-fast=   70.83  openblas=   72.13   98.2%  [ok]  N=  705  native-fast=   71.55  openblas=   72.53   98.7%  [ok]  N=  785  native-fast=   71.45  openblas=   72.49   98.6%  [ok]  N=  865  native-fast=   70.99  openblas=   73.02   97.2%  [ok]  N=  945  native-fast=   71.33  openblas=   73.10   97.6%  [ok]  N= 1025  native-fast=   69.81  openblas=   72.60   96.2%  [ok]
  median 97.4%   mean 97.4%   min 95.5%   max 98.8%   (10 sizes)
GATE PASS: gemm median 97.4% >= 80% of openblas; all 10 sizes >= the 70% floor (N >= 256).
The gate threshold is now met by a margin that makes the pass/fail verdict uninteresting. What the epic should ask next is a different question, since a kernel at 97% of OpenBLAS is no longer chasing single-core throughput — the remaining gap is in scaling, below.
Why the gate asserts the median — historical, from the 82% era
Section titled “Why the gate asserts the median — historical, from the 82% era”The material in this subsection is from the 2026-08-01 / 08-03 measurements, when native-fast sat at ~82% of OpenBLAS and per-size ratios swung by 6 points. It is retained because it is the evidence for how the gate is assessed, which #382 does not change. Note that the post-#382 spread is much tighter (95.5–98.8%, ~3 points), so the noise argument below is now less load-bearing than it was — but the median rule was chosen against the harder case, which is the right way round.
How the gate is assessed changed in #327, and the numbers below are why. The original rule failed if any single size fell under 80% — gating on the minimum, the noisiest statistic available. Repeating the identical protocol on an idle machine — same binaries, same sweep, same pinning — trips a different set of sizes:
| N | committed run | verification re-run |
|---|---|---|
| 305 | 80.6% | 78.7% LOW |
| 385 | 80.2% | 79.0% LOW |
| 465 | 76.3% LOW | 82.5% |
| 545 | 80.2% | 86.0% |
| 625 | 86.5% | 85.9% |
| 705 | 82.6% | 82.8% |
| 785 | 84.6% | 83.5% |
| 865 | 83.9% | 82.5% |
| 945 | 83.9% | 82.0% |
| 1025 | 82.1% | 79.2% LOW |
No size falls below the threshold in both runs, and the per-size spread reaches
6 points (N = 465: 76.3% vs 82.5%). A fine sweep 433:505:8 across the region
the first run flagged is flat — 55.8, 55.7, 58.6, 59.1, 58.7 at N = 465,
58.8, 58.7, 59.4, 59.3, 59.5 GFLOP/s — with no structure at that size.
Aggregating fixes this. Only one statistic here reproduces:
| statistic | run A | run B | swing |
|---|---|---|---|
| median of ratios | 82.3% | 82.5% | 0.2 pt |
| mean | 82.1% | 82.2% | 0.1 pt |
| min (the pre-#327 rule) | 76.3% | 78.7% | 2.4 pt |
So the gate now asserts the median ≥ 80%, with a per-size floor at 70% so a genuine cliff still fails while ±6-point noise does not. Both runs pass, which is the point: the verdict is a property of the kernel, not of which run you happened to take.
In that era native-fast was at ~82% of OpenBLAS across N ≥ 256, with individual sizes ranging 76–87%. Post-#382 the corresponding figures are 97.4% and 95.5–98.8%.
One correction to the earlier framing: raising the iteration count would not
have helped. Within-run stddev is only 0.3–2.2% of the median at 10 iterations —
the variance is between runs (turbo/thermal state, allocation, page layout),
not within them. The remaining lever is the powersave governor, listed under
caveats.
An earlier revision of this page reported the N = 465 result as a reproducible kernel dip. That was wrong: the “repeats” backing it were taken on a loaded machine (native-fast measured 38–40 GFLOP/s there against 56.9 idle) and were compared against sweep-protocol ratios instead of like-for-like isolated runs at neighbouring sizes. The control, run since, shows ordinary variation.
L1 and L2
Section titled “L1 and L2”nrm2 beats OpenBLAS comfortably (171% at N = 225, 316% at N = 1025). dot is
near parity (85–91%). axpy remains the weakest, at ~73–74% of OpenBLAS.
These moved between sessions, and #382 is not the explanation. hw_traits
is read only by simd/blocking.hpp, so the register-tile change cannot reach
the L1 kernels. Against 2026-08-03, native-fast measured:
| op | N = 1025, old → new | ratio vs OpenBLAS, old → new | attribution |
|---|---|---|---|
axpy | 16.80 → 23.03 (+37%) | 55% → 73% | undetermined |
nrm2 | 21.82 → 28.10 (+29%) | 246% → 316% | plausibly #384 |
dot | 21.13 → 21.13 (0%) | 101% → 85% | OpenBLAS moved, not us |
nrm2istwo_norm, and #384 gavetwo_norm/frobenius_normaResultparameter feeding bothround_tand the cast. A change in that path landing in the same window as a 29% move is plausible, but this page did not test it and does not claim it.axpyhas no corresponding commit in the window. Nothing between the two measurement dates touches it. Recorded as unexplained rather than folded into a story.dotis the useful control: native-fast is bit-identical across sessions (21.13 both times) while its ratio fell from 101% to 85% — because OpenBLAS moved from 20.92 to 25.00. A ratio changing when the numerator did not is worth flagging whenever these tables are read.
The earlier claim that axpy sits at “a steady ~50% of OpenBLAS … consistent
enough across sizes to be structural rather than noise” is retracted: it is
now 73–74%, and a 20-point move with no code change is exactly the noise the
earlier text ruled out.
LAPACK factorizations (single-threaded)
Section titled “LAPACK factorizations (single-threaded)”Same sweep and pinning. BLIS is absent by construction — it is a BLAS-only library, so an MTL5 build against it has no LAPACK path and a “blis” curve would silently be the generic path wearing a vendor label.
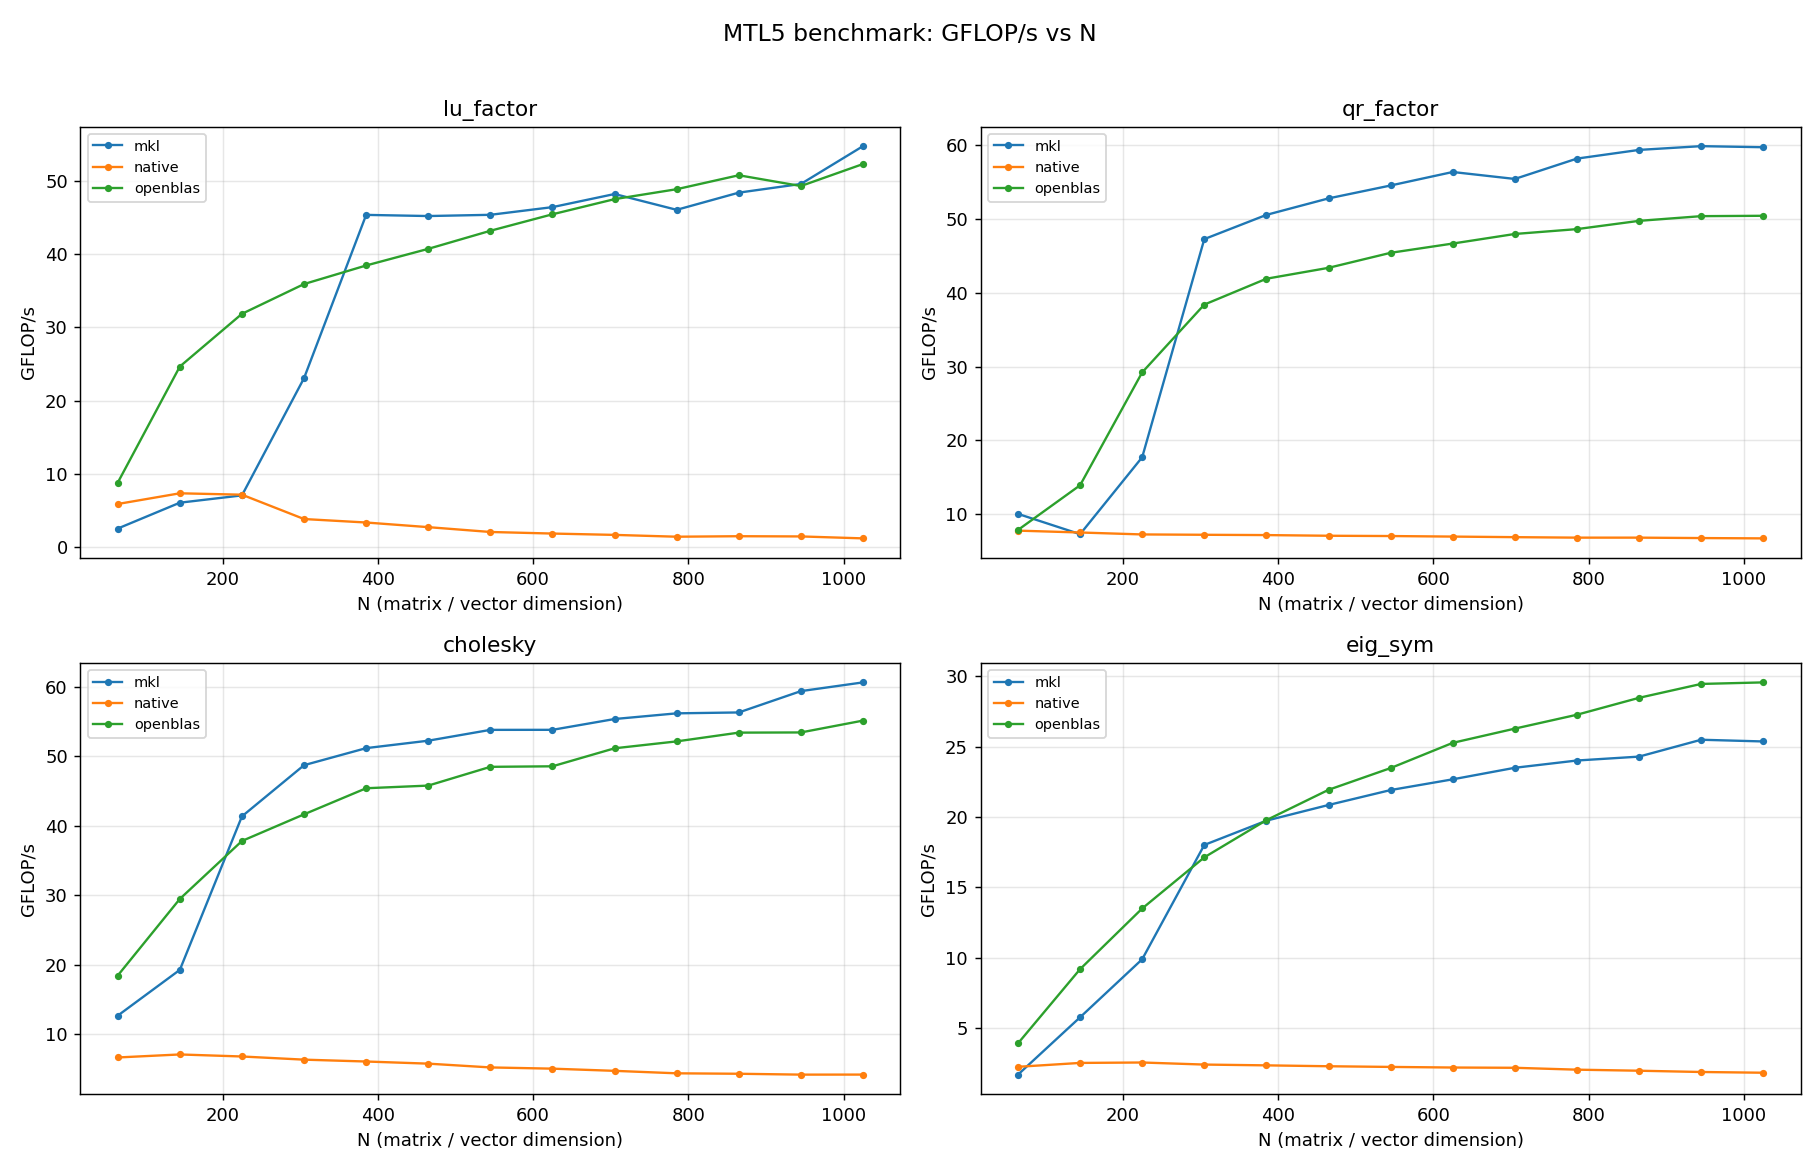
GFLOP/s at N = 1025:
| Operation | native | openblas | mkl |
|---|---|---|---|
lu_factor | 1.18 | 52.32 | 54.77 |
qr_factor | 6.74 | 50.41 | 59.69 |
cholesky | 4.21 | 55.13 | 60.63 |
eig_sym | 1.81 | 29.57 | 25.37 |
Native factorizations are 8–45× behind the vendors and the gap widens with
N: lu_factor falls from 5.87 GFLOP/s at N = 65 to 1.18 at N = 1025 as it loses
cache locality, while the vendors climb. Unlike GEMM, there is no tuned native
path here — these run the generic algorithms.
eig_sym is the one place a vendor loses: MKL trails OpenBLAS by ~17% at
N = 1025 (25.4 vs 29.6) and has done so past N ≈ 400 in earlier sessions too, so
it reproduces.
Multi-core GEMM scaling (#108)
Section titled “Multi-core GEMM scaling (#108)”GEMM at N = 2048, threads pinned to the first T physical P-cores (SMT siblings excluded), one process per thread count.
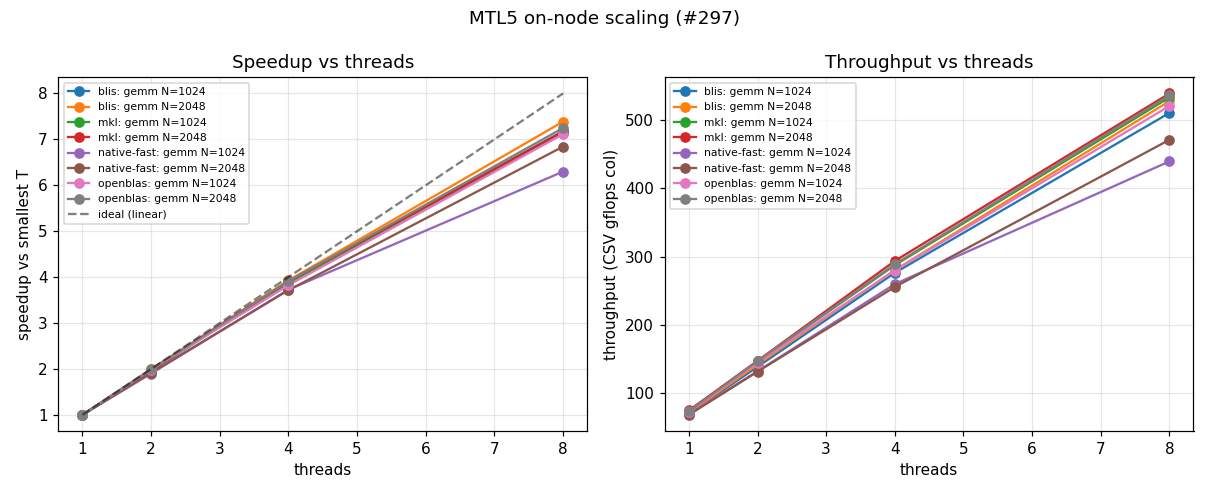
| T | native-fast | blis | openblas | mkl |
|---|---|---|---|---|
| 1 | 68.8 (1.00×) | 71.4 (1.00×) | 73.9 (1.00×) | 75.2 (1.00×) |
| 2 | 132.0 (1.92×) | 142.4 (1.99×) | 147.3 (1.99×) | 147.7 (1.97×) |
| 4 | 255.7 (3.72×) | 280.4 (3.93×) | 289.0 (3.91×) | 293.8 (3.91×) |
| 8 | 470.9 (6.84×) | 527.4 (7.39×) | 535.7 (7.25×) | 538.6 (7.17×) |
What #382 and #410 did to scaling
Section titled “What #382 and #410 did to scaling”Three measurement dates on the same table, so the story is worth stating once in full. GFLOP/s at 8 P-cores, and the parallel efficiency each implies:
| N = 1024 | N = 2048 | efficiency (N = 2048) | |
|---|---|---|---|
| pre-#382 | 388.9 | 401.8 | 90.5% |
| after #382 | 360.2 (−7.4%) | 429.4 (+6.9%) | 79.2% |
| after #410 | 439.4 (+22.0% vs #382) | 470.9 (+9.7% vs #382) | 85.5% |
#382 broke it. Its single-thread gain decayed monotonically with thread count — +21.5%, +9.6%, +3.6%, −7.4% at N = 1024 — going outright negative at 8 threads. The issue filed for it guessed cache pressure from the larger register tile. That guess was wrong, and the page said at the time that it was untested; it is now retracted outright.
The actual cause was a coupling, not a cost. mc was rounded down to a
multiple of mr, tying a cache block size to the register tile. The L2
budget yields exactly 64, which survives mr = 4 but drops to 60 under #382’s
mr = 6. Since the threaded nest hands ic-blocks to the team round-robin, the
block count is what sets the critical path:
| N | mc | ic-blocks | most-loaded thread | ideal | ratio |
|---|---|---|---|---|---|
| 1024 | 64 | 16 | 128 rows | 128 | 1.000 |
| 1024 | 60 | 18 | 180 rows | 128 | 1.406 |
| 2048 | 64 | 32 | 256 rows | 256 | 1.000 |
| 2048 | 60 | 35 | 300 rows | 256 | 1.172 |
Worse at the smaller size — which is exactly the sign flip observed. #410
decouples mc from the register tile and chooses the ic-block size at runtime,
where m and the thread count are known (#408, #410).
What is fixed, and what is not. The N = 1024 regression is gone, and absolute
throughput is now the highest measured on this machine at both sizes. But
efficiency is 85.5%, not the 90.5% of the pre-#382 era, and native-fast is
still last of the four scalers. Part of that is arithmetic — efficiency divides
by a T = 1 baseline that #382 raised 22%, so identical parallel machinery
scores lower — but not all of it: at 2 and 4 threads native-fast reaches 1.92×
and 3.72× where all three vendors are at 1.97–1.99× and 3.91–3.93×. Whatever
remains is in the parallel path, not the kernel, and is not tracked by an open
issue yet.
The earlier serial-region fix still stands on its own: inside each jc-team only the leader packed the shared B panel while the rest waited on the barrier — at N = 2048 one thread copying ~67 MB while seven idle. The team now packs disjoint panel ranges (#348, #110). #382 did not undo that; it changed the tile the packed data feeds.
Retracted: “threading is no longer what separates native-fast from the tuned libraries.” That claim rested on the relative throughput being flat across thread counts (75.5% at T = 1, 76.4% at T = 8). Tracking it across the three dates, against OpenBLAS at N = 2048:
| T = 1 | T = 8 | spread | |
|---|---|---|---|
| pre-#382 | 75.5% | 76.4% | flat |
| after #382 | 91.5% | 81.5% | 10 pt |
| after #410 | 93.1% | 87.9% | 6 pt |
#410 recovers most of the gap but does not restore the flatness, so the claim stays retracted. The honest reading is the reverse of the original: the single-core kernel is now the strong side at 93% of OpenBLAS, and the parallel path is what gives ground as threads are added.
Threaded kernel families (#297)
Section titled “Threaded kernel families (#297)”Native-only, MTL5_NUM_THREADS ∈ {1,2,4,8}, pinned to physical P-cores.
Best and worst T=1→T=8 speedup per family:
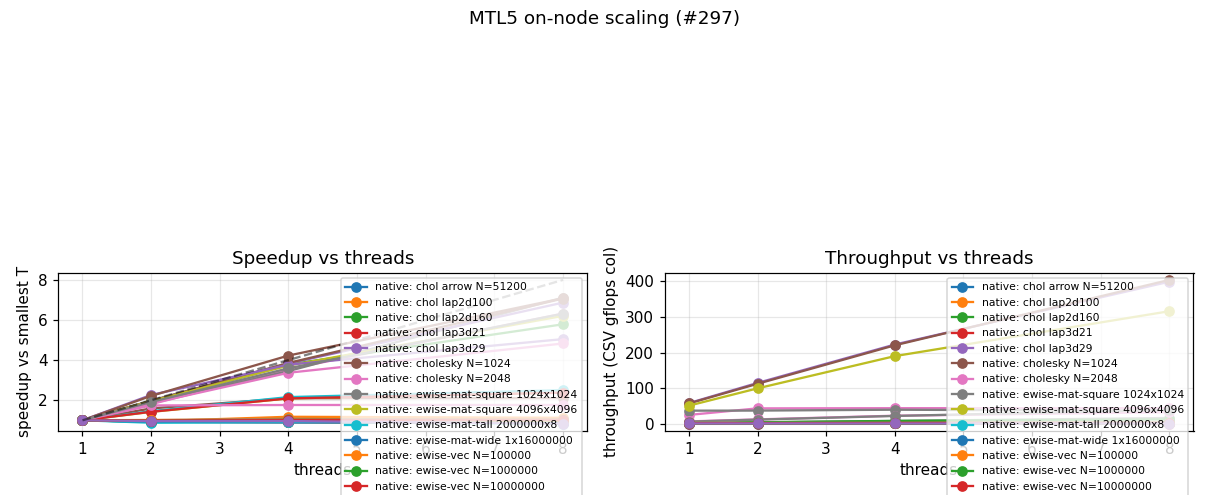
| Family | Cases | Best | Worst |
|---|---|---|---|
lu | 2 | 7.08× (N=2048) | 5.05× (N=1024) |
qr | 2 | 6.32× (N=2048) | 4.83× (N=1024) |
chol | 2 | 6.32× (N=2048) | 2.10× (N=1024) |
gemm_rect | 5 | 7.07× (2048×2048×1024) | 0.98× (64×4096×1024) |
ewise | 7 | 7.12× (1024×1024) | 1.01× (1×16000000) |
sparse | 17 | 1.05× (arrow) | 0.83× (2-D Laplacian) |
gemm_rect improved from 6.43× to 7.07× with the parallel B pack (#348),
which is the expected effect: it routes through the same blocked GEMM.
ewise also moved, 5.13× to 7.12×, but #348 cannot explain that — the
element-wise sweeps compute c = a + b and C = A + B through
detail::parallel_ewise and never touch GEMM. These are bandwidth-bound
measurements and the change is unattributed; treat it as run-to-run variation
rather than a result until something isolates it.
Dense factorizations scale well at N = 2048 but much less so at N = 1024 — Cholesky in particular collapses to 2.10×, where there is too little work per core to amortize the parallel decomposition.
The flat cases are structural, not defects. gemm_rect at 64×4096×1024 and
ewise on a 1×16,000,000 row are both single-row shapes with no parallelism on
the partitioned axis — the row-parallel gap tracked in #313.
Sparse triangular solves do not scale in any structure. The best case is the arrow matrix (one wide level) at 1.05×; the deep-narrow Laplacians are negative, down to 0.83×. This reproduces the existing #297 finding almost exactly (arrow 1.06×, 2-D Laplacian 0.87× there) and is the honest characterization: level scheduling parallelizes wide levels, and these systems do not have them. Note also that the factorization setup is serial and re-paid per process, so total wall clock is nearly flat across thread counts — measured at ~230 s per thread count in the 2026-08-01 run, which timed each phase; this pass did not re-time them.
Sparse direct solvers
Section titled “Sparse direct solvers”Single-threaded, pinned to one P-core, SuiteSparse matrices.
Native KLU vs SuiteSparse KLU (#138)
Section titled “Native KLU vs SuiteSparse KLU (#138)”| Matrix | n | nnz | blocks | native (s) | KLU (s) | ratio | fill ratio |
|---|---|---|---|---|---|---|---|
rajat14 | 180 | 1,503 | 19 | 0.00041 | 0.00140 | 0.29× | 1.10 |
add32 | 4,960 | 23,884 | 1 | 0.00510 | 0.00110 | 4.64× | 1.01 |
rajat30 | 643,994 | 6,175,377 | 11,705 | skipped | 7.07 | — | — |
Native KLU is 3.4× faster than SuiteSparse on rajat14, where the matrix
block-triangularizes into 19 small blocks and native’s lower per-block overhead
wins. On the single-block add32 it is 4.6× slower. Fill is essentially
identical on both (ratios 1.10 and 1.01), so this is kernel speed, not ordering
quality. rajat30 is marked external-only and the native run skipped.
Native LU vs SuperLU (#186)
Section titled “Native LU vs SuperLU (#186)”| Matrix | n | nnz | native (s) | SuperLU (s) | ratio | fill ratio |
|---|---|---|---|---|---|---|
add32 | 4,960 | 23,884 | 0.0049 | 0.0164 | 0.30× | 0.53 |
wang4 | 26,068 | 177,196 | 5.13 | 2.53 | 2.03× | 0.53 |
wang3 | 26,064 | 177,168 | 4.93 | 2.14 | 2.30× | 0.50 |
raefsky3 | 21,200 | 1,488,768 | 6.78 | 0.90 | 7.50× | 1.16 |
bbmat | 38,744 | 1,771,722 | 85.34 | 4.74 | 17.99× | 2.49 |
Native wins on the small, sparse add32 (3.3× faster, and with half the
fill). It loses by ~2× on the wang pair, 7.5× on raefsky3, and 18× on
bbmat.
Fill ratio correlates with the size of the gap, but does not order it. The
two matrices where native produces more fill than SuperLU — 1.16× on
raefsky3 and 2.49× on bbmat — are also the two worst results by a wide
margin. Below a fill ratio of 1 the relationship breaks down: add32, wang3
and wang4 all sit at 0.50–0.53, yet span 0.30× to 2.30× in time. add32 in
particular has slightly more fill than wang3 and is the only case native
wins, so the ordering within that group is driven by size and structure, not by
fill.
The mechanism still holds at the extremes: on dense-fill problems native loses twice over — it does more arithmetic, and does it with scalar non-supernodal kernels instead of BLAS-3. Closing that is precisely the supernodal work the epic tracks.
Residuals are sound throughout (1.1e-15 to 2.2e-14), so these are honest performance comparisons, not accuracy trade-offs.
Threading measurements (#636, #640)
Section titled “Threading measurements (#636, #640)”Published on 2026-10-25 with #645 and #647, under the i7’s pinning policy. These sections moved here from the systems page (#799).
A vendor BLAS inside an MTL5 region (#640)
Section titled “A vendor BLAS inside an MTL5 region (#640)”The test is a batch of 64 independent n×n dgemms, split across the 8 tids of one
MTL5 region. The vendor’s own team is also set to 8 threads. It runs pinned to
one logical CPU on each P-core (0,2,…,14). Each arm runs in its own process, 3
rounds, with the median of 15 reps after a 300 ms warm-up. The command is
OUTDIR=benchmarks/data/i7-12700k-vendor-nested BENCH_PCPUS=0,2,4,6,8,10,12,14 benchmarks/run_vendor_nested.sh; the data is in
benchmarks/data/i7-12700k-vendor-nested/. Vendors: OpenBLAS 0.3.32 (pthreads),
BLIS 1.1 (OpenMP) and MKL 2026.1 (Intel10_64lp, Intel OpenMP). The governor
is powersave, and each run waited for a 1-minute load average below 1.
The arms:
uncapped: each tid callsdgemm_directly, which is what MTL5 did before #640.capped: each tid calls throughmtl::interface::blas::gemm.direct: the whole batch is called from one thread outside a region, so the vendor’s team is the only parallelism.process1: OpenBLAS set to one thread withopenblas_set_num_threads(1), the process-wide configuration the threading docs give it.
Median GFLOP/s over the rounds, with the range in brackets where it is wider than 10%:
| Vendor | Arm | n = 128 | n = 256 | n = 512 |
|---|---|---|---|---|
| BLIS | uncapped | 0.1 | 0.6 | 3.0 |
| BLIS | capped | 405 | 457 | 507 |
| BLIS | direct | 190 | 331 | 442 |
| MKL | uncapped | 328 | 338 [305–369] | 381 [308–393] |
| MKL | capped | 499 | 468 | 513 |
| MKL | direct | 380 | 391 | 473 |
| OpenBLAS | uncapped | 244 | 163 [108–259] | 289 [284–407] |
| OpenBLAS | capped (no per-thread control: same code as uncapped) | 249 | 105 [102–253] | 391 [289–401] |
| OpenBLAS | process1 | 462 | 430 | 486 |
| OpenBLAS | direct | 257 | 338 | 429 |
What it shows:
- BLIS without the cap collapses, by ×170 to ×3800. Each of the 8 tids starts
an 8-thread OpenMP team, so 64 spinning threads share 8 cores. With the cap it
runs at 405–507 GFLOP/s, which is also faster than
direct(×1.15 to ×2.1): 8 independent single-thread GEMMs keep every core busier than one 8-thread GEMM of the same size. - MKL degrades without the cap, but less, and the cap gains ×1.35 to ×1.52. The uncapped arm also varies more between rounds.
- OpenBLAS cannot be capped per thread, and with 8 concurrent callers it is
erratic. One arm configuration measured 102 GFLOP/s in one round and 259 in
another.
uncappedandcappedrun the same code, so their difference is that spread, not a result. The documented configuration, OpenBLAS at one thread for the whole process, is both the fastest and the steadiest arm: ×1.7 to ×2.6 overuncapped, within 0.5% between rounds. - The checksums of every arm agree at each size.
A small vendor call does not measure the cap’s per-call cost. Once a region’s
first vendor call has set the vendor to one thread, every later call checks a
thread-local flag. A 256-element ddot timed through the wrapper and directly
moved by up to 2× between processes in either direction. That included the
OpenBLAS build, where the cap compiles to nothing at all, so that arm was taken
out of the benchmark.
Pool dispatch and join latency (#636)
Section titled “Pool dispatch and join latency (#636)”Many near-empty regions run on a pool of T threads, and each one is timed with
steady_clock (the invariant TSC here). Three latencies are recorded:
- dispatch: from the caller’s last timestamp before
run()to the latest worker’s entry into the task; - join: from the latest tid’s exit from the task to the caller’s return;
- region: the whole
run().
The arms are:
thread:thread_pool.spin:spin_poolwith its default spin of 4096 iterations, about 140 µs on a P-core.sleep:spin_poolwith spin 0, so every wait sleeps at once.hold:spin_poolwith a spin of 40000 iterations, about 1.4 ms, which outlasts the gap.
The gap between regions is either 0 (back to back) or 1000 µs (a 1 kHz loop).
Runs are pinned to one logical CPU per P-core (0,2,…,14). Each arm runs in its
own process, for 4 rounds with the arm order rotated each round, so every arm
runs in every position once: 20000 regions at gap 0 and 2000 at gap 1000. The
command is OUTDIR=benchmarks/data/i7-12700k-pool-latency BENCH_PCPUS=0,2,4,6,8,10,12,14 benchmarks/run_pool_latency.sh, and the data is
in benchmarks/data/i7-12700k-pool-latency/. The governor is powersave, and
the 1-minute load average was 1.4 at the start.
Region latency in µs, as p50 / p99 / max, each the median over the rounds:
| Gap | Arm | T = 2 | T = 4 | T = 8 |
|---|---|---|---|---|
| 0 | thread | 3.03 / 3.57 / 39.6 | 3.32 / 5.23 / 73.5 | 6.08 / 7.99 / 39.6 |
| 0 | spin | 0.23 / 0.25 / 4.6 | 0.31 / 0.38 / 6.1 | 0.48 / 0.57 / 7.4 |
| 0 | sleep | 0.27 / 0.44 / 5.9 | 0.55 / 0.70 / 12.9 | 0.79 / 2.41 / 12.4 |
| 0 | hold | 0.24 / 0.25 / 3.3 | 0.34 / 0.39 / 6.4 | 0.51 / 0.60 / 7.9 |
| 1000 | thread | 20.4 / 102 / 573 | 24.9 / 118 / 223 | 41.4 / 58.4 / 1478 |
| 1000 | spin | 10.6 / 98.0 / 172 | 12.4 / 110 / 129 | 16.3 / 61.1 / 1368 |
| 1000 | sleep | 15.5 / 98.6 / 137 | 13.0 / 109 / 196 | 16.7 / 72.5 / 579 |
| 1000 | hold | 0.68 / 0.98 / 5.4 | 0.83 / 1.18 / 6.0 | 1.06 / 1.37 / 608 |
What it shows:
- Back to back,
spin_poolis about 10× faster thanthread_poolat every percentile up to p99: 0.23–0.48 µs per region at the median against 3.0–6.1 µs. Most ofthread_pool’s time is the condition-variable wake on dispatch (1.4–4.1 µs p50) and the matching wake of the caller on join (1.5–1.6 µs). spin_poolwith spin 0 is still faster thanthread_pool, 0.27–0.79 µs at the median. libstdc++‘sstd::atomic::waititself spins 16 times (12 pauses, then 4 yields) before it calls the futex. Back to back, the next region often arrives within that window, and no mutex is taken.- At 1 kHz with the default spin, every pool pays the kernel’s wake-up. The
gap outlasts the spin, so the workers are asleep when the region arrives:
10–17 µs at the median, about 100 µs at p99, and maxima up to 1.5 ms. These
are wake-ups from idle cores under
powersave, not costs of the pool.spin_pool’s join stays fast even then (0.5 µs p50 against 9–11 µs), because the caller is awake and spinning. hold, a spin longer than the gap, keeps a 1 kHz loop at about 1 µs: p99 1.0–1.4 µs, max 6 µs at T ≤ 4. At T = 8 the pool fills all 8 pinned cores, so anything else the OS runs there preempts a spinner, and the max rises to 608 µs. A real-time deployment gives the pool cores of its own, as the threading docs say. The cost is 8 cores spinning continuously.- A yield in the spin loop matters when the pool fills its cores. Before
every 64th spin iteration became a yield,
spinat T = 8 and gap 1000 had a dispatch median of 155 µs in all three rounds of that run, whilesleepstayed at 20 µs. The scheduler had placed two of the pool’s threads on one core, and the spinner held it. With the yield the median is 16 µs. - Widening the dispatch word to 64 bits cost nothing measurable. The word was 32 bits, with a generation that could wrap, and libstdc++ waits on a 4-byte atomic with a futex directly but on an 8-byte one through a shared table. With the workers asleep at 1 kHz, the dispatch median was 10.1–15.9 µs with the 32-bit word (3ace550) and 9.6–15.6 µs with the 64-bit one (1e32af6).
Caveats
Section titled “Caveats”- Run-to-run variance is larger than it looks. For the sweeps the CPU
governor was
powersave(intel_pstate), so clocks were not pinned (the #737 sessions useperformance), and each size is a median over a small iteration count. Repeating the GEMM sweep moved individual sizes by up to 6 percentage points relative to OpenBLAS. Treat differences under ~5 points between two sizes, or between two runs, as noise — a single size in a single run is not evidence of anything. - A loaded machine changes the numbers by ~30%. Measurements taken while other work was running put native-fast GEMM at 38–40 GFLOP/s where the idle machine gave 56.9 at the same size (pre-#382 figures; the idle number is now ~70). Every table here was measured on an idle machine; anything measured otherwise is not comparable.
- Not every between-session move has an explanation, and this page says so.
The 2026-08-05 pass found two changes that no commit in the window accounts
for: MKL’s small-N GEMM (17.5 → 71.1 GFLOP/s at N = 65) and native-fast
axpy(+37%). Both are marked undetermined in place rather than attributed to a plausible-sounding cause. The one such cause that was tested — a cold P-core still at its 800 MHz idle clock — was refuted by direct measurement (60.8 GFLOP/s cold vs 61.0 warm). Treat any single number here as reproducible only to the extent the page shows it repeated. - Absolute GFLOP/s also depend on the measurement protocol. A short single-size process reports lower numbers than the same size inside a warm sweep. Every table on this page comes from sweeps; do not compare these figures against numbers taken another way.
- FMA peak is taken as ~78 GFLOP/s for one P-core in fp64 (AVX2, 2 FMA/cycle × 4 doubles × 2 flops × ~4.9 GHz). Percentages of peak inherit that estimate.
- The
#297sparse family ran at grid sides 100,160. That was an override at the time; it is now the driver default, because the previous200,320did not complete on this machine (#321). Sparse cost is dominated by the untimed factorization and grows steeply with the grid side — 11 s at side 100 versus 8 m 46 s at side 200, per thread count.
Reproducing
Section titled “Reproducing”The platform benchmark’s sessions are run with
benchmarks/machines/i7-12700k-platform.sh and published with
benchmarks/publish_platform.cmake. Their repeatability comes from
benchmarks/compare_sessions.py on the two session directories under
benchmarks/data/i7-12700k/mtl5_bench/. The roofline is drawn from the second
session:
benchmarks/plot_roofline.py benchmarks/data/i7-12700k/mtl5_bench/20261112T004852Z \ --out docs/img/benchmarks/intel-i7-12700k/roofline-platform.svgBuilds and sweeps follow the harness README. The
CSVs backing every table are committed under benchmarks/data/, and the figures
are regenerated with:
benchmarks/plot_results.py benchmarks/data/blas_sweep_*.csv --out docs/img/benchmarks/intel-i7-12700k/blas-sweep-gflops.pngbenchmarks/plot_results.py benchmarks/data/lapack_sweep_*.csv --out docs/img/benchmarks/intel-i7-12700k/lapack-sweep-gflops.pngbenchmarks/analyze_scaling.py benchmarks/data/gemm_scaling_*.csv --plot docs/img/benchmarks/intel-i7-12700k/gemm-scaling.pngbenchmarks/analyze_scaling.py benchmarks/data/scaling_*.csv --plot docs/img/benchmarks/intel-i7-12700k/kernel-scaling-297.png