Benchmark Results — AMD Ryzen 9 8945HS
Full benchmark results for the ryzen-9-8945hs system described on the
benchmark systems page, under the pinning policy documented
there.
Provenance. Two measurement dates, and which one applies depends on the section:
| Section | Measured | Why |
|---|---|---|
| Platform benchmark (#737) | 2026-11-12 | The capability card’s two sessions (#721, #737); a different benchmark from every section below it |
| Every other section | 2026-08-02 | One session: every figure comes from the same set of builds |
This is the first Windows / MSVC results page, and the first on AMD Zen 4.
Read it together with the system description — and note that its backend set
differs from the Intel i7-12700K page by necessity (BLIS has no
MSVC build; OpenBLAS is the official prebuilt binary, not vcpkg’s generic one;
MKL comes from the mkl-devel wheel). These are not portable performance claims.
Headline findings
Section titled “Headline findings”- The native-fast kernels are SSE2 under MSVC, the likely explanation of
most of the gate failure below (#737). The platform benchmark’s sidecars record
Highway’s target for native-fast as
SSE2. MTL5 compiles Highway for its static target only, without run-time dispatch, and MSVC without/archtargets SSE2: 128-bit vectors, no FMA. On one core, native-fast GEMM at 512³ reaches 21–33% of OpenBLAS in the two sessions. See Platform benchmark (#737). - The #82 GEMM acceptance gate FAILS on this machine — native-fast is at ~32% of OpenBLAS (median 32.0% for N ≥ 256), far below the epic’s 80% target. On the i7 the same gate passes at 82%. The gap is entirely in the native-fast kernel: OpenBLAS and MKL reach the same ~70 GFLOP/s here as on the i7, but MTL5’s Highway blocked-GEMM delivers only ~22 GFLOP/s under MSVC on Zen 4, against ~59 GFLOP/s under GCC on the i7. This is an MSVC-codegen / native path finding, not a hardware one — the vendors show the silicon is fine.
- The generic C++ path is ~7× slower than native-fast (3.1 vs 22.8 GFLOP/s
at N = 1025) and ~23× slower than the vendors. MSVC’s autovectorizer does much
less with the portable triple-loop than GCC
-O3does (native is ~3 GFLOP/s here vs ~5 on the i7). - MKL pays the well-known AMD penalty. It matches OpenBLAS on single-thread
GEMM but loses badly on
eig_sym(14.3 vs 27.6 GFLOP/s) and, most visibly, in multi-core scaling — at 8 threads OpenBLAS reaches 437 GFLOP/s to MKL’s 289. - Native factorizations are 15–30× behind the vendors, as on the i7 — there is no tuned native LAPACK path.
- native-fast scales well (6.16× on 8 cores, 77% efficiency) — the parallel decomposition is sound; it is the single-core kernel that is behind.
- Native sparse solvers lose to SuiteSparse everywhere on MSVC — native KLU
wins nothing here (it beat SuiteSparse on
rajat14under GCC), and native LU trails SuperLU by 2.5–23.8×. The fill ratios match the i7 exactly, so the extra gap is again the slower MSVC native kernel, not ordering quality.
Platform benchmark (#737)
Section titled “Platform benchmark (#737)”Measured on 2026-11-12. This section reads the machine’s
capability card: mtl5_bench, the platform
benchmark of #721, which runs every operation family at fixed sizes and
reports each against the machine’s measured FMA peak and bandwidth. It is a
different benchmark from the sweeps in the sections below. Their sizes and
protocols differ, so compare the two only through ratios taken within one
benchmark.
| Sessions | 20261112T030915Z and 20261112T032806Z (the card shows the second), a cold boot between them |
| Commit | cd6762a6e989 |
| Compiler | MSVC 19.52.37029, /O2 /Ob2 /DNDEBUG, no /arch. Highway’s target is SSE2 |
| Cores | the 8 physical cores, SMT siblings idle: CPUs 0, 2, 4, …, 14 |
| Clock policy | a copy of the Balanced power scheme with processor state 100–100%, EPP 0 and aggressive boost, on AC |
| Runs | native, native-fast and blas (OpenBLAS), each at 1 and 8 threads, class medium. 0 failed checks |
| Repeatability | 580 of 666 entries (87.1%) within ±5% between the two sessions |
Repeatability. This is the least repeatable machine of the campaign. The median ratio between the sessions is 0.997–0.999 in every run, but two runs carry most of the outliers:
native-t8, 26 entries outside ±5%. The sessions record their background activity (#787). At 03:22Z, inside the second session’s window (03:17:13Z to 03:28:06Z; a session’s ID is the time its runs ended), Windows Update installed an update and Defender’s security intelligence was updated. The logs don’t time the individual runs, so the update can’t be tied tonative-t8for certain. No Defender scan ran in either session.native-fast-t1, 24 entries. A block of dense kernels is 1.4–1.6× slower in the second session:gemmf64 and f32,luf64 and f32,symm,gemmt,trmm. They move together, and nothing in the background record coincides with them. It is unexplained.
The card by area
Section titled “The card by area”The median %roof of each area. Areas without a roofline are left out.
| area | native 1T | native 8T | native-fast 1T | native-fast 8T | blas 1T | blas 8T |
|---|---|---|---|---|---|---|
| blas1 | 20% | 84% | 103% | 110% | 18% | 81% |
| blas2 | 44% | 61% | 54% | 62% | 76% | 100% |
| blas3 | 12% | 2% | 14% | 5% | 71% | 44% |
| factor | 3% | 1% | 3% | 1% | 13% | 2% |
| eigen | 3% | 0% | 4% | 0% | 17% | 2% |
| elementwise | 7% | 5% | 7% | 6% | 6% | 6% |
| sparse | 22% | 32% | 21% | 36% | 22% | 21% |
| direct | 0% | 0% | 0% | 0% | 0% | 0% |
| smoother | 31% | 28% | 30% | 29% | 31% | 30% |
| mg | 29% | 29% | 29% | 29% | 29% | 29% |
| mixed | 11% | 11% | 59% | 58% | 11% | 11% |
blas1on one core is at 103% in native-fast and 18–20% in the other two builds. Under MSVC the generic vector loops don’t come close to the memory roof on one core, and the explicit SSE2 kernels do.blas3in native-fast (14%) is barely above the generic build (12%). The SSE2 GEMM kernel gains little over MSVC’s code for the portable loops.
Roofline
Section titled “Roofline”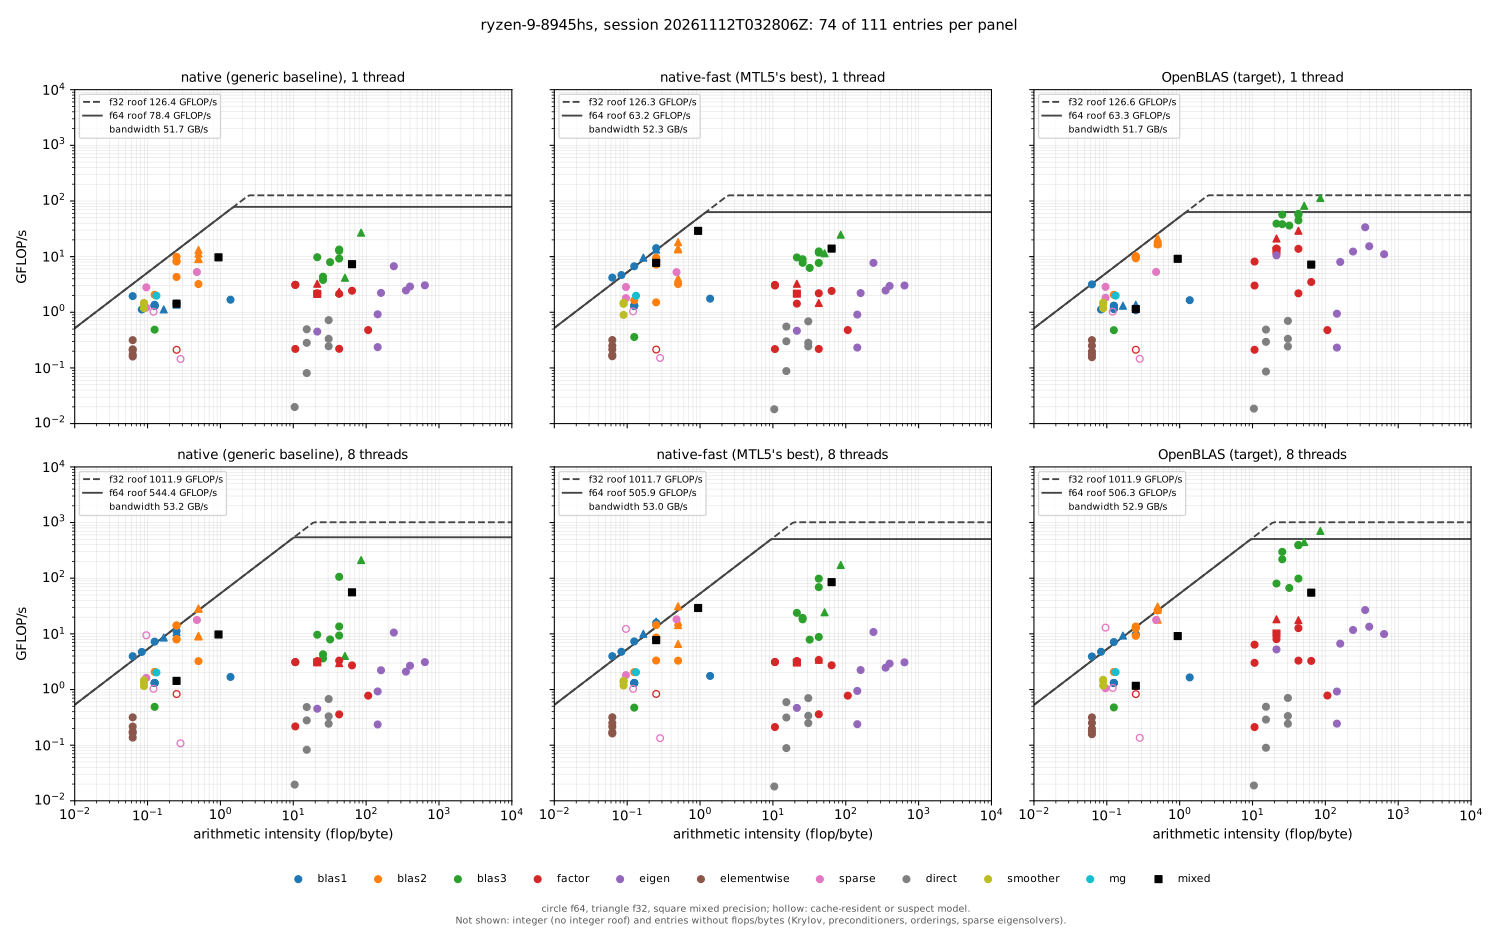
Each panel places one build’s entries at their arithmetic intensity (flops per
byte moved) and their measured GFLOP/s. The rows are 1 thread and all 8
threads. The columns are the generic native build, the baseline a
straightforward implementation gives; native-fast, the best MTL5 does; and
the blas build, where OpenBLAS and its LAPACK take the dense kernels: what
tuned libraries reach, and so MTL5’s target. The lines are each run’s own
roofs: the measured bandwidth up to the ridge, then the FMA peak, solid for
f64 and dashed for f32. An entry at 100% of its roof sits on the line. Integer
entries are left out, because the model has no integer ceiling, and so are the
28 entries that record no flops or bytes (Krylov solvers, preconditioners,
orderings and sparse eigensolvers). That leaves 74 of the 111 entries in each
panel.
Across the columns:
- Level 3 separates OpenBLAS from both MTL5 builds. GEMM is at 17%, 20% and 93% of the FMA peak on one core, and at 19%, 19% and 78% on eight. native-fast gains almost nothing over the generic build here, because both are SSE2 (see the headline).
- The factorizations and eigensolvers rise only in the OpenBLAS column,
where LAPACK takes them. The
factormedian is 3% in both MTL5 builds and 13% with OpenBLAS, and theeigenmedian is 3–4% against 17%. - native-fast leads on the memory-bound kernels on one core.
blas1is at a median 103% of its roof, against 20% for the generic build and 18% for OpenBLAS. On eight threads all three are at 81–110%. - The elementwise kernels and the sparse direct solvers don’t move between columns, because no build replaces them.
Within the native-fast column:
- The memory-bound points line up along the slope:
blas1at a median 103% of its roof on one core and 110% on eight. - A few memory-bound points sit slightly above the slope. The slope is the
best of three bandwidth probes (triad, read and update), not a hard limit,
and a kernel with a lighter read/write mix can beat it.
scalereaches 128% on one core.spmvat 241% on eight is flagged as a suspect model (hollow). - No compute-bound point reaches half the ceiling. The ceiling is the
hardware’s FMA peak, while the build is SSE2 (see the headline). GEMM sits
at 20% of it on one core and 17–19% on eight. An
/archbuild would show how much of that gap is the instruction set. - Points far under the slope at an intensity near 0.06 are the elementwise
transcendentals (
sin,erf,log,exp,sqrt). The model counts one flop per element, but each costs tens of instructions, so they are compute- bound in fact and sit 10–20× under the slope on one core. - The compute-bound points other than level 3 sit far under the ceiling: at most a third of it, and the sparse direct solvers under 4%. These are the factorizations at 512×512, the dense eigensolvers at 256×256 and the sparse direct solvers. Their flop counts are nominal, and most of their time goes to panels, pivoting, iteration and indirect access, not to FMAs at full width.
GEMM at 512³
Section titled “GEMM at 512³”blas3/gemm, GFLOP/s and % of the measured FMA peak (about 63 GFLOP/s per
core in f64, 506 on eight). native-fast is shown for both sessions, because
they differ by 1.56×.
| native | native-fast | OpenBLAS | native-fast / OpenBLAS | |
|---|---|---|---|---|
| f64, 1 thread, session 1 | 19.34 (31%) | 58.65 (90%) | 33% | |
| f64, 1 thread, session 2 (card) | 13.41 (17%) | 12.42 (20%) | 58.82 (93%) | 21% |
| f64, 8 threads (card) | 105.99 (19%) | 98.27 (19%) | 393.83 (78%) | 25% |
| f32, 1 thread, session 1 | 38.58 (30%) | 112.93 (90%) | 34% | |
| f32, 1 thread, session 2 (card) | 26.96 (21%) | 24.80 (20%) | 113.07 (89%) | 22% |
| f32, 8 threads (card) | 212.00 (21%) | 172.86 (17%) | 709.02 (70%) | 24% |
- Session 1 agrees with the sweep below, which found native-fast at 32.0% of OpenBLAS for N ≥ 256. Session 2 is the slow mode described under Repeatability.
- At eight threads, native-fast is no faster than the generic build. Both scale about 7.9× in f64, and both end at about a quarter of OpenBLAS.
- The likely fix is a build flag, not a kernel, but it is unmeasured. An
/arch:AVX2(orAVX512) build of native-fast would give Highway an AVX2 or AVX-512 target. On the i7-12700K under GCC, withAVX2, the same GEMM reaches 98% of OpenBLAS. There is no MSVC measurement with/archyet, so whether it closes the gap here is a hypothesis until one is taken. - Mixed precision is native-fast’s.
mixed/gemmreaches 13.9 GFLOP/s on one core against 7.2–7.3 in the other two builds, andblock_scaled_dot29.1 against 9.1–9.7.
Interleave width
Section titled “Interleave width”From Interleave width across the benchmark machines,
taken in the same sessions on CPU 0. Under MSVC and clang-cl, W = 8 is the
fastest width of every generic row kernel, or within 0.2% of it. The x86-64
default of #798 is 8, so it costs nothing here. The previous default, 6, cost
up to 31% under clang-cl (f64 trmv).
Column-major gemv in native-fast (#804, fixed)
Section titled “Column-major gemv in native-fast (#804, fixed)”In these sessions, column-major gemv in native-fast takes 22.3 ms on one core
against 7.8 ms in the generic build and 3.6 ms in OpenBLAS: 2.9× slower than the
generic build. The same gap appeared on every machine of the campaign.
The cause was the kernel’s traversal, which #809 fixed (see the i7-12700K page). This machine was not part of #809’s A/B runs, so it was checked afterwards (2026-11-13): MSVC, SSE2, one core, n = 4096, the commit before #809 against #809’s, two runs each, agreeing within 1%.
| dtype | before #809 | #809 | generic build, these sessions |
|---|---|---|---|
| f64 | 22.23 ms | 4.00 ms | 7.8 ms |
| f32 | 7.24 ms | 2.54 ms |
Without FMA (MSVC defines no __FMA__ below AVX2), the kernel takes two columns
per pass instead of four, and still beats the generic build by 2×. Row-major
gemv doesn’t move (3.49 ms in both). The cards keep the session figures until
the next session.
Dense BLAS (single-threaded)
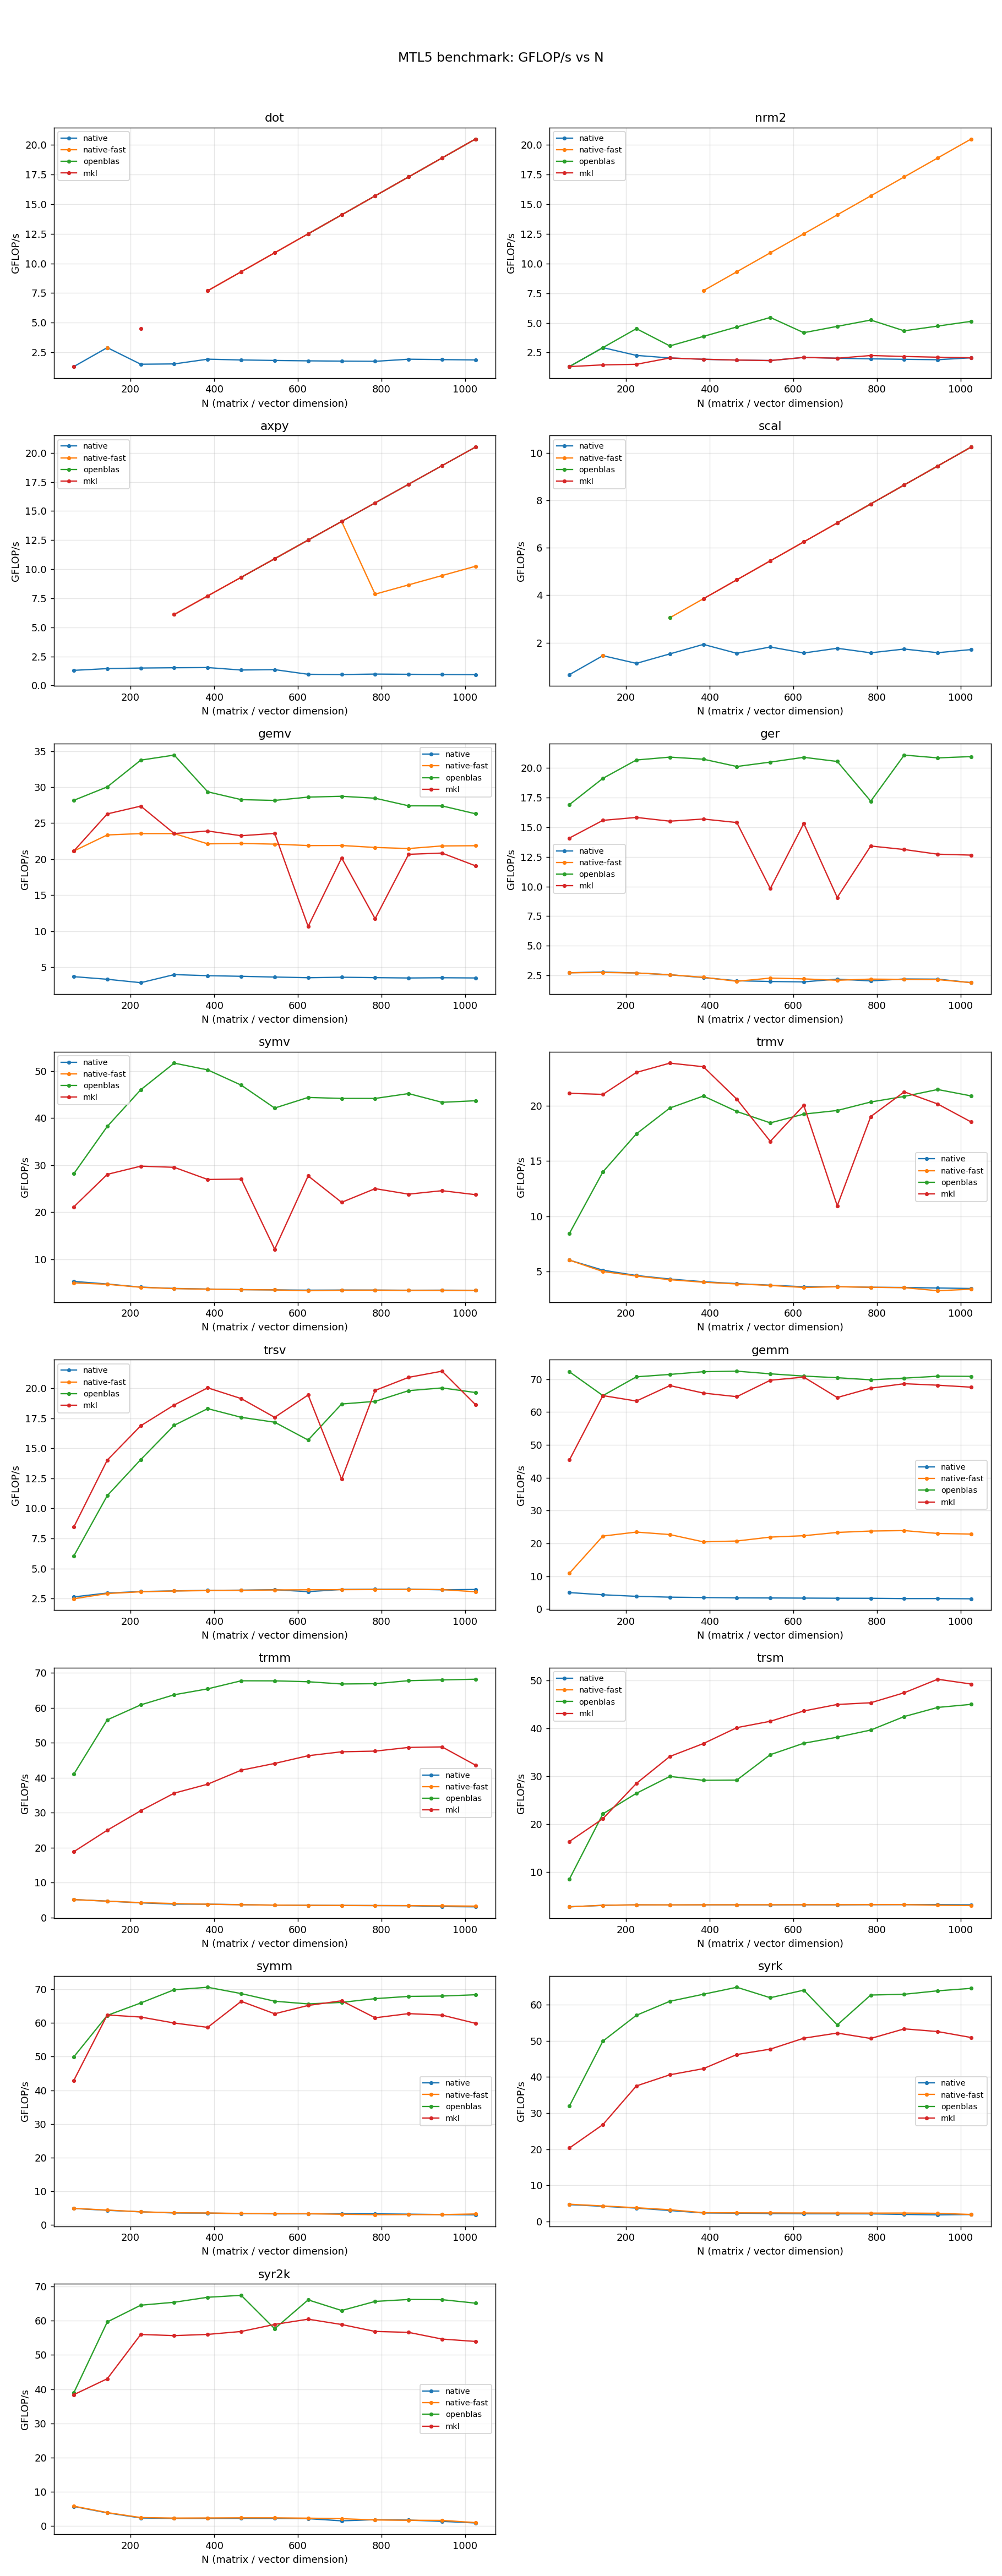
Section titled “Dense BLAS (single-threaded)”Sweep 65:1025:80 — deliberately odd, non-power-of-2 sizes — pinned to physical
core 0 (affinity mask 0x1), every vendor’s threading forced to 1.
GEMM, GFLOP/s
Section titled “GEMM, GFLOP/s”| N | native | native-fast | openblas | mkl |
|---|---|---|---|---|
| 65 | 5.0 | 10.9 | 72.3 | 45.4 |
| 145 | 4.3 | 22.2 | 65.0 | 65.0 |
| 305 | 3.6 | 22.7 | 71.5 | 68.1 |
| 465 | 3.4 | 20.7 | 72.4 | 64.7 |
| 705 | 3.3 | 23.3 | 70.5 | 64.4 |
| 1025 | 3.1 | 22.8 | 70.9 | 67.6 |
OpenBLAS is the fastest backend at nearly every size, and unlike on the i7,
MKL never overtakes it — MKL’s dispatch selects a less aggressive path on an
AuthenticAMD CPU. Both vendors sit at ~65–72 GFLOP/s, essentially the same
absolute performance as the i7’s ~70–75, so the memory subsystem and cores are
delivering.
native-fast is the story. It flattens at ~22 GFLOP/s for N ≥ 145 — roughly
where the i7 build reaches ~56 with the identical source. The kernel is compiled
by MSVC without -march=native (a no-op for MSVC; the flag is GCC/Clang only),
so it leans entirely on Highway’s runtime dispatch, and the result is well short
of what the same kernels achieve under GCC. The generic native path is worse
still, and declining with N as it falls out of cache — the portable fallback,
not a contender.
Epic #82 acceptance gate — FAILING at 32.0%
Section titled “Epic #82 acceptance gate — FAILING at 32.0%”The gate asks whether MTL5’s own kernels land within 10–20% of OpenBLAS for GEMM at N ≥ 256 (median ≥ 80%, per-size floor 70%). Against this session’s data:
benchmarks/analyze_gate.py data/ryzen-9-8945hs/blas_sweep_native-fast.csv \    data/ryzen-9-8945hs/blas_sweep_openblas.csv --gate --op gemm \    --threshold 0.80 --min-size 256
  median 32.0%   mean 31.6%   min 28.3%   max 34.0%   (10 sizes)
GATE FAIL: gemm vs openblas — median 32.0% < 80%; 10 sizes below the 70% floor
Every size is deep under the floor, with a tight 28–34% spread — this is not
run-to-run noise (which moves individual sizes by a few points), it is a
structural ~3× kernel deficit. The gate was calibrated on GCC/Linux and is met
there; it does not hold for the MSVC build of the native path on Zen 4. The
honest reading is that the Highway blocked-GEMM needs MSVC-specific attention
(or an /arch:AVX2-equivalent build path) before it is competitive on this
toolchain — the hardware clearly is, as OpenBLAS’s 72 GFLOP/s on the same core
shows.
L1 and L2
Section titled “L1 and L2”dot is bandwidth-bound and native-fast matches OpenBLAS exactly (~20.5 GFLOP/s,
100%). nrm2 is a native-fast win — 20.5 vs OpenBLAS’s 5.1 (this OpenBLAS
build has a weak nrm2). axpy reproduces the i7’s outlier precisely:
native-fast holds ~50% of OpenBLAS (10.2 vs 20.5), a store-path / unrolling
limit that is consistent across the sweep and therefore structural. gemv is
at ~83% of OpenBLAS.
LAPACK factorizations (single-threaded)
Section titled “LAPACK factorizations (single-threaded)”Same sweep and pinning. All three backends here have a LAPACK path — the official OpenBLAS Windows binary bundles LAPACK, so unlike BLIS on the i7 page, OpenBLAS appears in this table.
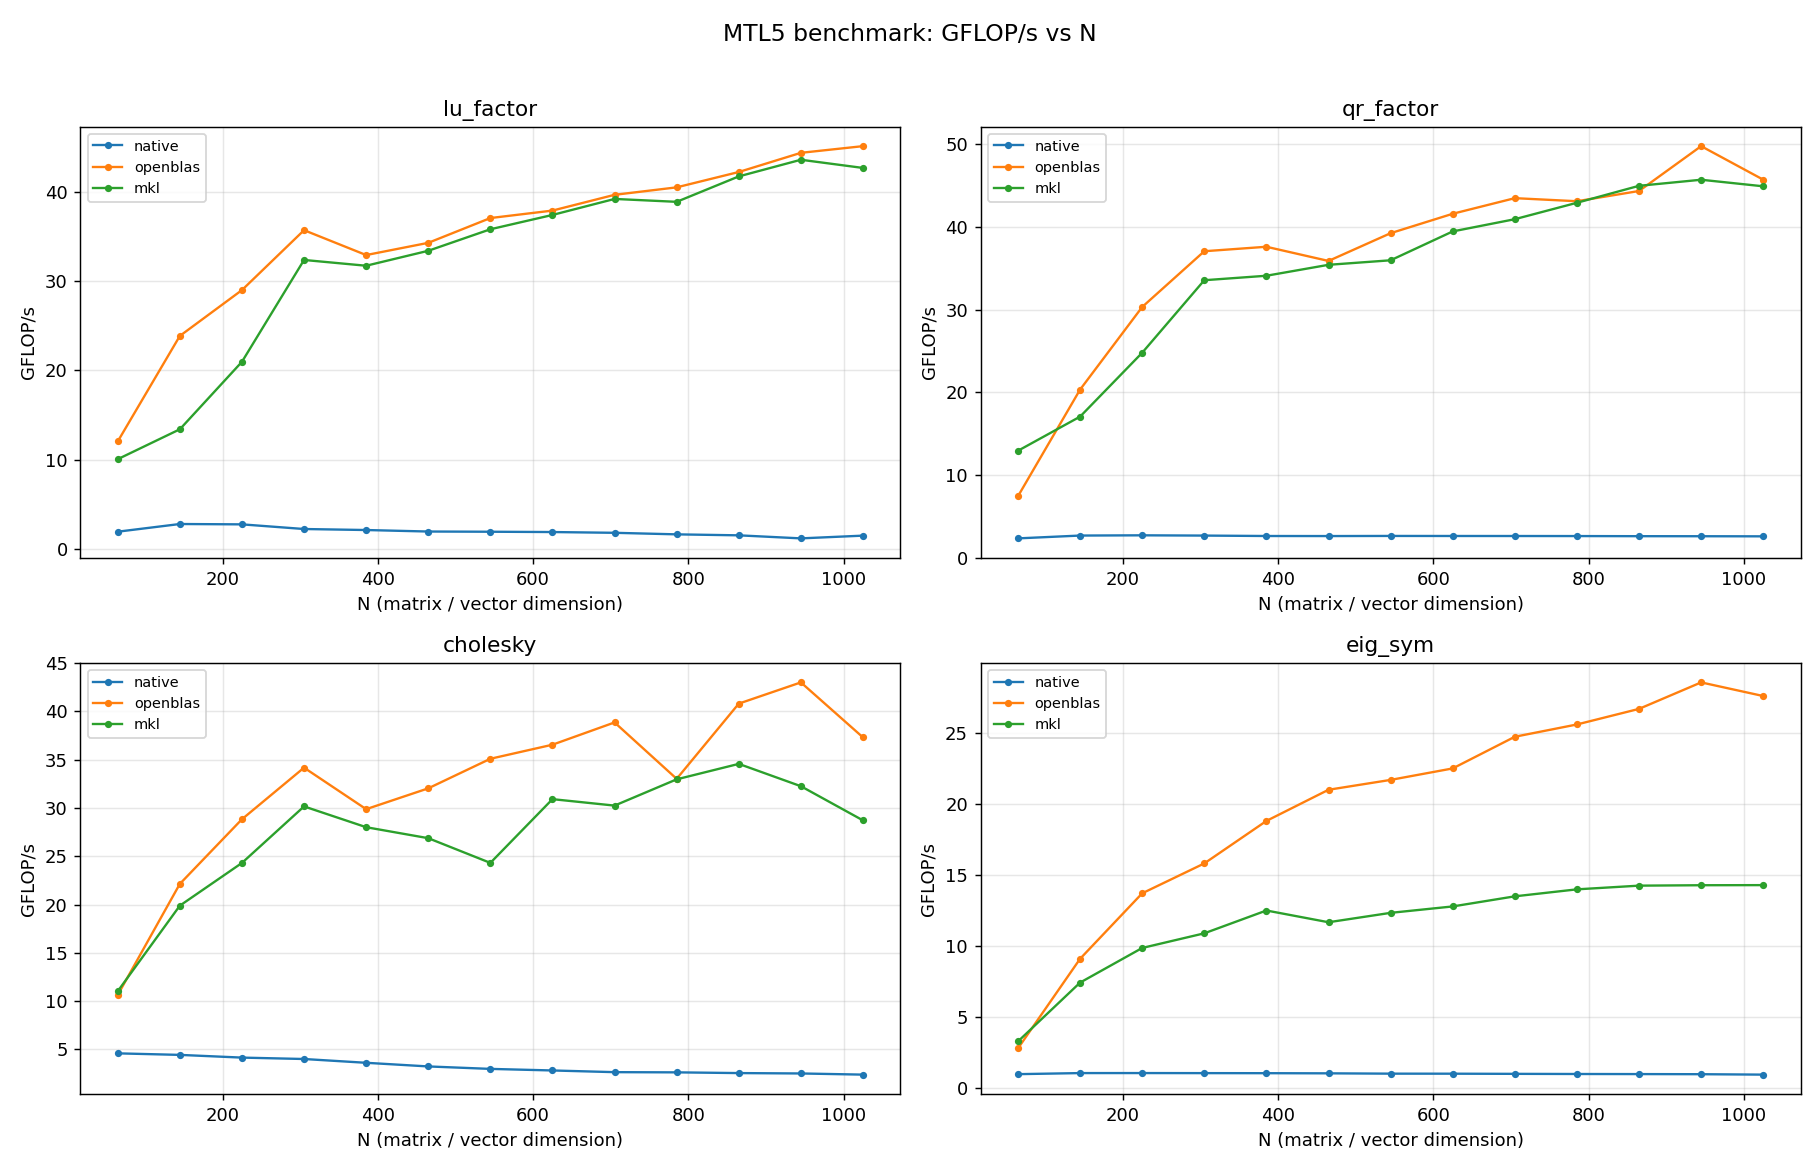
GFLOP/s at N = 1025:
| Operation | native | openblas | mkl |
|---|---|---|---|
lu_factor | 1.50 | 45.09 | 42.65 |
qr_factor | 2.59 | 45.71 | 44.91 |
cholesky | 2.40 | 37.30 | 28.71 |
eig_sym | 0.97 | 27.61 | 14.31 |
Native factorizations are 15–30× behind the vendors and the gap widens with
N — the generic algorithms have no tuned path, exactly as on the i7. eig_sym
is the slowest native case at under 1 GFLOP/s.
OpenBLAS beats MKL on every factorization here, and by ~2× on the symmetric eigensolver (27.6 vs 14.3) and ~1.3× on Cholesky — again the AMD dispatch penalty, now on the LAPACK side.
Multi-core GEMM scaling
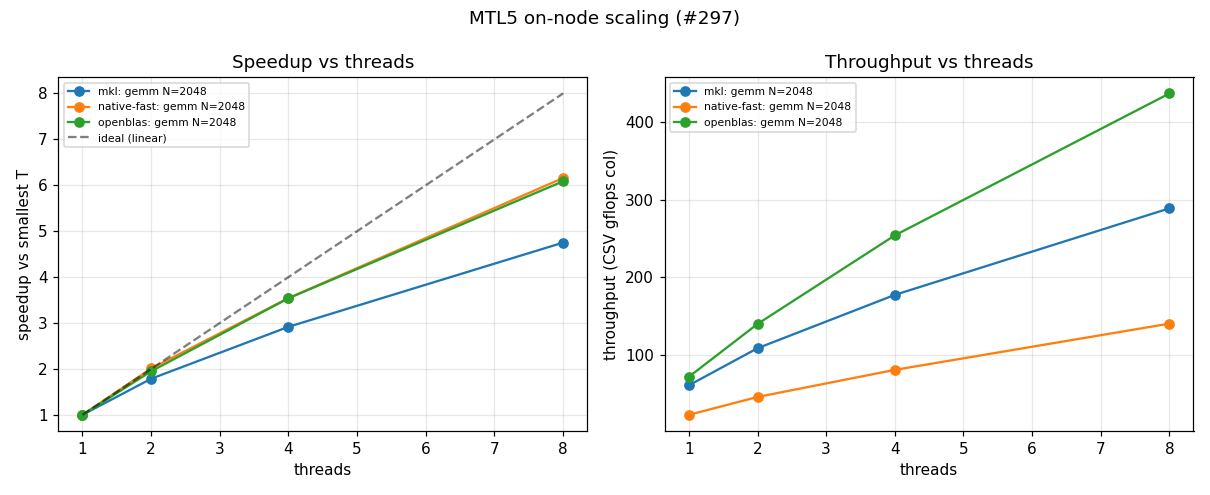
Section titled “Multi-core GEMM scaling”GEMM at N = 2048, threads pinned to the first T physical cores (SMT siblings
excluded, affinity masks 0x1, 0x5, 0x55, 0x5555), one process per thread
count.
| T | native-fast | openblas | mkl |
|---|---|---|---|
| 1 | 22.8 (1.00×) | 71.8 (1.00×) | 60.8 (1.00×) |
| 2 | 45.8 (2.01×) | 139.9 (1.95×) | 108.6 (1.79×) |
| 4 | 80.7 (3.54×) | 254.1 (3.54×) | 177.4 (2.92×) |
| 8 | 140.3 (6.16×) | 437.0 (6.09×) | 288.9 (4.75×) |
native-fast scales the best of the three (6.16× on 8 cores, 77% parallel efficiency) — its parallel decomposition is healthy; the deficit is purely in the single-core kernel, so it stays ~3× behind OpenBLAS at every thread count rather than falling further behind.
MKL scales the worst (4.75×, 59% efficiency) and at 8 threads trails OpenBLAS by 1.5× in absolute throughput (289 vs 437 GFLOP/s) — the AMD penalty compounds with thread count. OpenBLAS is the clear multi-core leader on this part.
Threaded kernel families (#297)
Section titled “Threaded kernel families (#297)”Native-fast build, MTL5_NUM_THREADS ∈ {1,2,4,8}, pinned to physical cores.
Dense factorizations swept at N = 1024, 2048; the sparse family at 2-D grid
sides 100, 160. (The i7 page also ran N = 4096, dropped here — the generic
native factorizations are ~3× slower under MSVC, so a 4096 T=1 baseline is
impractical.) Best and worst T=1→T=8 speedup per family:
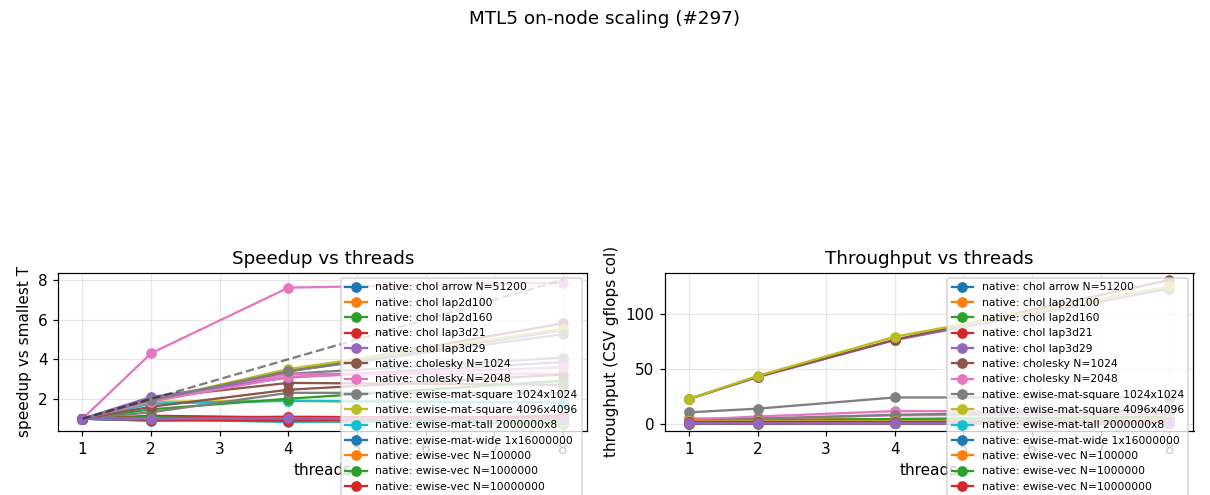
| Family | Cases | Best | Worst |
|---|---|---|---|
lu | 2 | 3.85× (N=1024) | 3.23× (N=2048) |
qr | 2 | 5.26× (N=2048) | 3.59× (N=1024) |
chol | 2 | 7.86× (N=2048) | 2.71× (N=1024) |
gemm_rect | 5 | 5.81× (2048×2048×1024) | 2.30× (64×4096×1024) |
ewise | 7 | 4.08× (1024×1024) | 0.80× (vec N=100000) |
sparse | 17 | 1.15× (snlu, lap2d side 100) | 0.75× (snlu, lap2d side 100) |
Cholesky scales best at N = 2048 (7.86×, even higher than the i7’s 6.24×) but
collapses to 2.71× at N = 1024 — too little work per core to amortize the
parallel decomposition, the same cliff the i7 shows. qr follows the same shape
(best at 2048). lu is the weak one here: 3.2–3.9× where the i7 reached 5.7–7.3×,
and unusually its 1024 case edges out its 2048 case.
The flat cases are structural, not defects — gemm_rect at 64×4096×1024 and
ewise on a long vector are single-axis shapes with no parallelism on the
partitioned dimension (ewise even goes negative at 0.80×, memory-bound), the
same row-parallel gap the i7 records.
Sparse triangular solves do not scale in any structure — best 1.15×, worst 0.75×, both on 2-D Laplacians. This reproduces the i7 finding (and the original #297 result) almost exactly: level scheduling only parallelizes wide levels, and these systems don’t have them.
Sparse direct solvers
Section titled “Sparse direct solvers”Single-threaded, pinned to physical core 0, SuiteSparse matrices. SuperLU’s internal BLAS calls resolve against the same optimized OpenBLAS used above, so its supernodal kernels are not handicapped. Time ratios are native ÷ external (>1 means the vendor is faster).
Native KLU vs SuiteSparse KLU (#138)
Section titled “Native KLU vs SuiteSparse KLU (#138)”| Matrix | n | nnz | blocks | native (s) | KLU (s) | ratio | fill ratio |
|---|---|---|---|---|---|---|---|
rajat14 | 180 | 1,503 | 19 | 0.001 | 0.000 | 4.1× | 1.10 |
add32 | 4,960 | 23,884 | 1 | 0.010 | 0.002 | 6.3× | 1.01 |
rajat30 | 643,994 | 6,175,377 | 11,705 | skipped | 9.51 | — | — |
Unlike on the i7, native KLU wins nothing here. On the i7/GCC build native was
3.4× faster than SuiteSparse on the block-triangular rajat14 (ratio 0.29×);
under MSVC it is 4.1× slower on the same matrix, and 6.3× slower on the
single-block add32 (vs 4.6× on the i7). Fill is essentially identical on both
solvers (1.01–1.10), so this is purely kernel speed — and the native kernel is
markedly slower under MSVC, the same theme as the dense native path. rajat30
is marked external-only; the native run is skipped.
Native LU vs SuperLU (#186)
Section titled “Native LU vs SuperLU (#186)”| Matrix | n | nnz | native (s) | SuperLU (s) | ratio | fill ratio |
|---|---|---|---|---|---|---|
add32 | 4,960 | 23,884 | 0.009 | 0.003 | 2.5× | 0.53 |
wang4 | 26,068 | 177,196 | 7.56 | 2.59 | 2.9× | 0.53 |
wang3 | 26,064 | 177,168 | 6.90 | 2.09 | 3.3× | 0.50 |
raefsky3 | 21,200 | 1,488,768 | 10.43 | 1.12 | 9.3× | 1.16 |
bbmat | 38,744 | 1,771,722 | 133.6 | 5.61 | 23.8× | 2.49 |
The fill-ratio story reproduces the i7 exactly — 0.50–0.53 on add32/wang3/
wang4, 1.16 on raefsky3, 2.49 on bbmat — and the two matrices where native
produces more fill than SuperLU (raefsky3, bbmat) are again the two worst
results by a wide margin. The mechanism holds: on dense-fill problems native
loses twice, doing more arithmetic with scalar non-supernodal kernels.
What differs from the i7 is the baseline. There, native won add32 (0.30×,
with half the fill); here the same matrix goes to SuperLU by 2.5×, and bbmat
widens from 18× to 23.8×. The extra fill is identical to the i7 — the additional
gap is the slower MSVC native kernel, consistent with every other native result
on this page.
Caveats
Section titled “Caveats”-
This is MSVC, not GCC. Every difference from the i7 page that involves the
nativeornative-fastpath is dominated by the compiler, not the CPU. The vendor libraries (OpenBLAS, MKL) are the like-for-like comparison, and they land within a few percent of the i7’s absolute GFLOP/s. -
native-fast is not built with an explicit wide-ISA flag. MSVC ignores
-march=native(MTL5_NATIVE_ARCH), so the whole native-fast build is compiled for the MSVC baseline, SSE2.Corrected (2026-11, #737). This caveat used to say that “only Highway’s dispatched kernels target AVX2/AVX-512”. MTL5 doesn’t use Highway’s run-time dispatch, so the Highway kernels are SSE2 too: the platform benchmark’s sidecars record
simd_backend=SSE2for native-fast. That makes the missing/archflag the leading explanation of the #82 gate failure. An MSVC build with/archwould confirm it. -
Clocks are not pinned in the sweeps. Windows ran its balanced power plan (the #737 sessions use a copy of it pinned to 100% processor state); the 8945HS is a 35–54 W mobile part that boosts to ~5.2 GHz but sustains lower under load. Treat differences under ~5 points between two sizes or two runs as noise.
-
Absolute GFLOP/s depend on the measurement protocol. Every table here comes from warm sweeps; short single-size runs report lower numbers. Do not compare these against figures taken another way.
-
MKL is the
mkl-develwheel (2026.1), linked viamkl_rt. It is the same library and version the i7 page used; only the packaging differs.
Reproducing
Section titled “Reproducing”The platform benchmark’s sessions are run with
benchmarks/machines/ryzen-9-8945hs-platform.ps1 and published with
benchmarks/publish_platform.cmake. Their repeatability comes from
benchmarks/compare_sessions.py on the two session directories under
benchmarks/data/ryzen-9-8945hs/mtl5_bench/. The roofline is drawn from the second
session:
benchmarks/plot_roofline.py benchmarks/data/ryzen-9-8945hs/mtl5_bench/20261112T032806Z \ --out docs/img/benchmarks/amd-ryzen-9-8945hs/roofline-platform.svgBuilds and sweeps use the Windows PowerShell harnesses (the MSVC equivalents of the bash scripts), which pin with processor-affinity bitmasks:
$env:VCPKG_ROOT = "C:\path\to\vcpkg"benchmarks\run_sweeps.ps1 -Variants native,native-fast,openblas,mkl -Suites blas -Sweep 65:1025:80 -OutDir benchmarks\data\ryzen-9-8945hsbenchmarks\run_sweeps.ps1 -Variants native,openblas,mkl -Suites lapack -Sweep 65:1025:80 -OutDir benchmarks\data\ryzen-9-8945hsbenchmarks\run_scaling.ps1 -Variants native-fast,openblas,mkl -Threads 1,2,4,8 -Sizes 2048 -OutDir benchmarks\data\ryzen-9-8945hsThe CSVs backing every table are committed under
benchmarks/data/ryzen-9-8945hs/, each with a .sysinfo companion recording the
machine identity (self-reported by mtl::util::identify()). Figures are
regenerated with:
benchmarks/plot_results.py benchmarks/data/ryzen-9-8945hs/blas_sweep_*.csv --out docs/img/benchmarks/amd-ryzen-9-8945hs/blas-sweep-gflops.pngbenchmarks/plot_results.py benchmarks/data/ryzen-9-8945hs/lapack_sweep_*.csv --out docs/img/benchmarks/amd-ryzen-9-8945hs/lapack-sweep-gflops.pngbenchmarks/analyze_scaling.py benchmarks/data/ryzen-9-8945hs/gemm_scaling_*.csv --plot docs/img/benchmarks/amd-ryzen-9-8945hs/gemm-scaling.pngThe #297 threaded kernel-family sweep (native-fast, one CSV per family):
benchmarks\run_scaling_297.ps1 -Threads 1,2,4,8 -LapackSizes 1024,2048 -SparseSizes 100,160 -OutDir benchmarks\data\ryzen-9-8945hsbenchmarks/analyze_scaling.py benchmarks/data/ryzen-9-8945hs/scaling_*.csv --plot docs/img/benchmarks/amd-ryzen-9-8945hs/kernel-scaling-297.pngThe sparse scoreboards use bench_klu / bench_superlu (built with the vcpkg
toolchain + -DMTL5_WITH_SUITESPARSE_KLU=ON -DMTL5_WITH_SUPERLU=ON, plus a BLAS
for SuperLU’s internal kernels), run against the SuiteSparse matrices fetched by
benchmarks/fetch_klu_matrices.sh / fetch_superlu_matrices.sh:
bench_klu.exe --csv benchmarks\data\ryzen-9-8945hs\klu_scoreboard.csv data\klu\rajat14\rajat14.mtx data\klu\add32\add32.mtx ext:data\klu\rajat30\rajat30.mtxbench_superlu.exe --csv benchmarks\data\ryzen-9-8945hs\superlu_scoreboard.csv data\superlu\add32\add32.mtx data\superlu\wang4\wang4.mtx data\superlu\wang3\wang3.mtx data\superlu\raefsky3\raefsky3.mtx data\superlu\bbmat\bbmat.mtx