Benchmark Results — NVIDIA Jetson Orin Nano
An assessment of the jetson-orin system described on the
benchmark systems
page. It is read from the capability cards of the platform benchmark of
#721, and from the interleave sweeps taken in the same sessions (#780).
Provenance. Everything on this page comes from two sessions on 2026-11-11, except Sessions of 2026-11-13 and the later figures under Fixed since these sessions: the A/B runs of the fixes and the 2026-11-13 confirmations. The two 2026-11-11 sessions used the same commit and the same build, and the machine had a cold boot between them. The published card has since moved to the 2026-11-13 pair, so its figures differ from the ones quoted outside those sections.
| Sessions | 20261111T190610Z and 20261111T193624Z (raw data). The card now shows a later pair, 20261113T131507Z and 20261113T140622Z |
| Commit | bfa1c2822688 |
| Compiler | GCC 11.4.0, -O3 -DNDEBUG, MTL5_NATIVE_ARCH=ON. There is no Clang on this machine |
| Cores | all six Cortex-A78AE, CPUs 0–5, pinned with taskset |
| Clock policy | nvpmodel 25 W (mode 1) and jetson_clocks: all six cores at 1344 MHz |
| Runs | native, native-fast and blas (OpenBLAS), each at 1 and 6 threads, class medium |
| Failed checks | 0 |
| Repeatability | 643 of 666 entries (96.5%) within ±5% between the two sessions |
The power mode differs from the earlier cache-blocking A/B on this machine, which ran at 15 W with unpinned clocks (cache-blocking A/B). Don’t compare figures between the two.
Headline findings
Section titled “Headline findings”- This is the most repeatable machine of the campaign: 96.5% of entries within ±5%, with a median ratio of 1.000 in every run. The outliers are dominated by one known effect, the bimodal 6-thread integer gemm (#785).
- native-fast GEMM reaches 60% of the FMA peak on one core and 64% of OpenBLAS. OpenBLAS is at 94% of peak. With six threads native-fast scales 5.0× and stays at 58% of OpenBLAS.
- One core reaches less than half the memory bandwidth. A single core
streams 16.1 GB/s, against 35.0 GB/s for all six. Bandwidth-bound kernels
therefore gain from threads here:
gemvgains 2.6–3.0×, while on the Ventuno’s A78C, where one core already saturates memory, it gains 1.3×. - GCC’s f32 triangular kernels show #795. In the generic
nativebuild, f32trmvandtrsvtake 26.5 and 26.9 ms against 12.0 ms for f64. Halving the data should make f32 faster, not 2.2× slower. The per-ISA defaults of #798 set these kernels to W = 2 under GCC on AArch64, which the interleave sweep measures at 6.8–6.9 ms. They postdate these sessions. The cause was thekeep_scalarbarrier; without it on AArch64, W = 4 takes 6.31 and 5.58 ms and is now the default (#795). - native-fast column-major
gemvwas 3.2× slower than the generic build: 50.1 ms against 15.6 ms, on every machine of the campaign. #809 fixed it (#804); see Fixed since these sessions.
The 2026-11-11 card by area
Section titled “The 2026-11-11 card by area”The median %roof of each area, from the “Across the runs” section of session
20261111T193624Z’s card.
Areas without a roofline (orderings, Krylov, preconditioners, sparse
eigensolvers, integer) are left out. Their times are in that card.
| area | native 1T | native 6T | native-fast 1T | native-fast 6T | blas 1T | blas 6T |
|---|---|---|---|---|---|---|
| blas1 | 72% | 91% | 74% | 93% | 72% | 91% |
| blas2 | 35% | 51% | 50% | 23% | 64% | 60% |
| blas3 | 33% | 6% | 50% | 19% | 89% | 72% |
| factor | 13% | 2% | 13% | 2% | 42% | 11% |
| eigen | 16% | 3% | 16% | 3% | 37% | 7% |
| elementwise | 8% | 4% | 8% | 4% | 8% | 4% |
| sparse | 31% | 26% | 32% | 25% | 32% | 26% |
| direct | 1% | 0% | 1% | 0% | 1% | 0% |
| smoother | 49% | 22% | 49% | 22% | 49% | 22% |
| mg | 40% | 20% | 40% | 20% | 40% | 20% |
| mixed | 33% | 15% | 66% | 34% | 33% | 15% |
How to read it:
- The 6-thread compute roof is six times the 1-thread one, so a
compute-bound area that doesn’t thread drops by up to 6× in this table
without getting any slower. The memory roof grows only 2.2× (16.1 to
35.0 GB/s). That is
most of the drop in
factor,eigenanddirect: at 512×512 the native factorizations gain 1.4× from six threads, OpenBLAS’s LU 2.4×. - blas1 is near the bandwidth roof in every build. The vector kernels don’t depend on the build.
- blas2 at 6 threads, native-fast (23%) is below native (51%). Most of
the gap is the column-major
gemv: 20% of the roof in native-fast against 59% in native. The row-majorgemvis at 76% (f64) and 86% (f32).trmvandtrsvdon’t gain from threads in either build.
Roofline
Section titled “Roofline”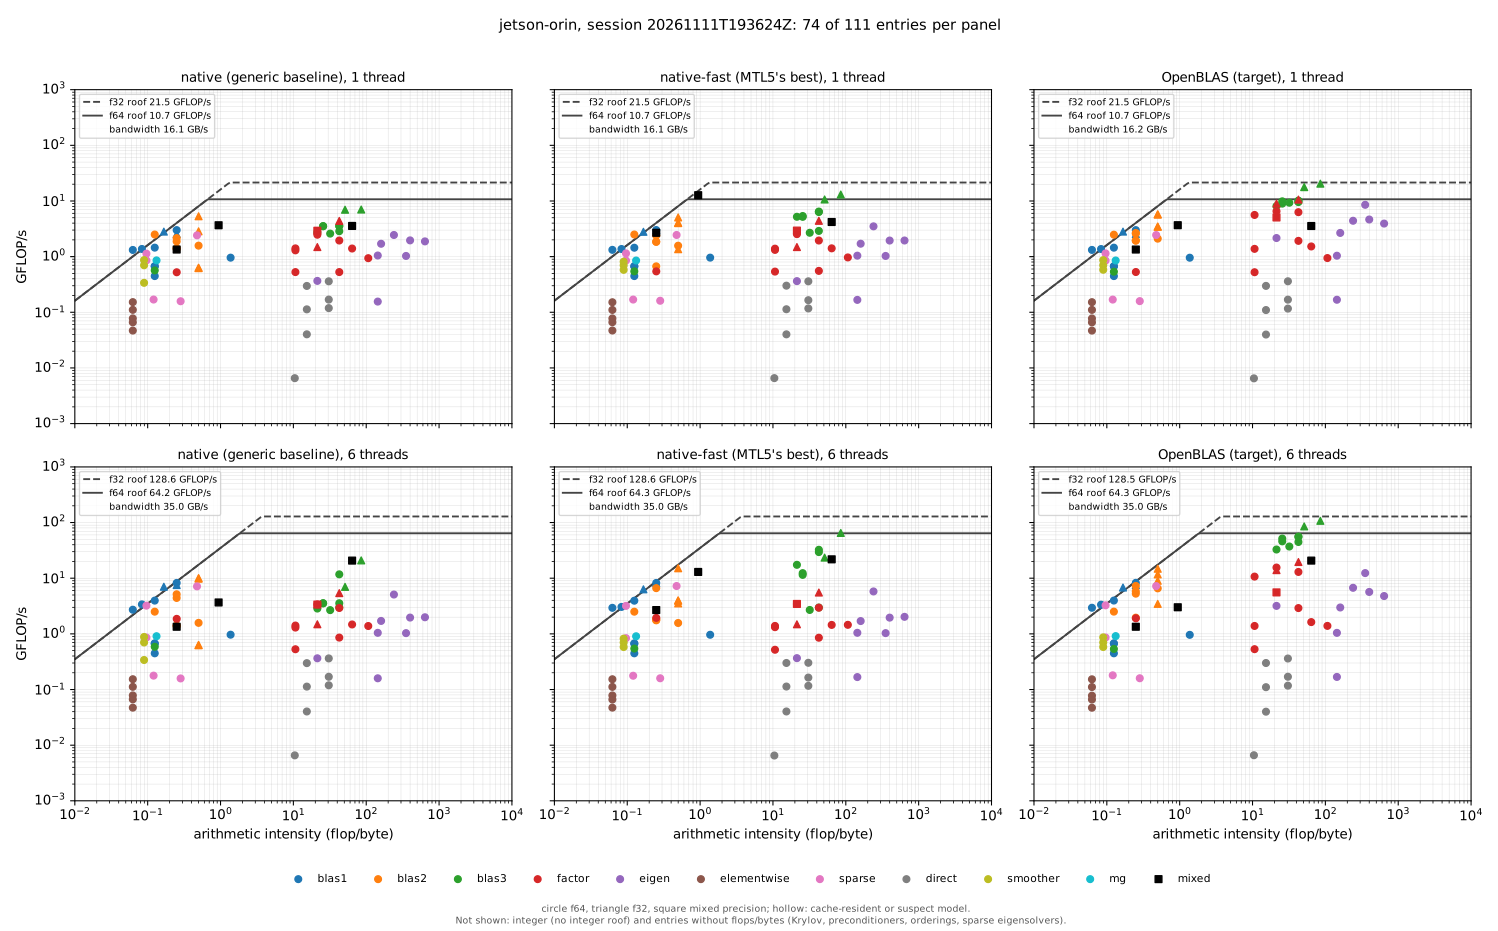
Each panel places one build’s entries at their arithmetic intensity (flops per
byte moved) and their measured GFLOP/s. The rows are 1 thread and all 6
threads. The columns are the generic native build, the baseline a
straightforward implementation gives; native-fast, the best MTL5 does; and
the blas build, where OpenBLAS and its LAPACK take the dense kernels: what
tuned libraries reach, and so MTL5’s target. The lines are each run’s own
roofs: the measured bandwidth up to the ridge, then the FMA peak, solid for
f64 and dashed for f32. An entry at 100% of its roof sits on the line. Integer
entries are left out, because the model has no integer ceiling, and so are the
28 entries that record no flops or bytes (Krylov solvers, preconditioners,
orderings and sparse eigensolvers). That leaves 74 of the 111 entries in each
panel.
Across the columns:
- Level 3 is where the builds separate. GEMM is at 33%, 60% and 94% of the FMA peak on one core, and at 18%, 50% and 86% on six. native-fast closes 44–47% of the gap from the baseline to OpenBLAS.
- The factorizations and eigensolvers rise only in the OpenBLAS column,
where LAPACK takes them. The
factormedian is 13% in both MTL5 builds and 42% with OpenBLAS; LU f64 is at 23–24% against 61%. - The memory-bound entries sit on the slope in every column.
blas1is at a median 72%, 74% and 72%. Where bandwidth is the limit, the build matters little. - The elementwise kernels and the sparse direct solvers don’t move between columns, because no build replaces them: 8% and 1% in all three.
Within the native-fast column:
- The memory-bound points line up along the slope. On one core the
blas1entries are at a median 74% of their roof,blas2, the smoothers and the V-cycle at 40–50%. At six threads the slope rises to the module’s 35 GB/s;blas1follows it (93%), and the kernels that don’t thread fall away from it. - Level 3 is the only area near the ceiling. GEMM is at 60% of the FMA peak on one core and 50% on six, and the other level-3 kernels at 512³ between 25% and 59% on one core.
- A few memory-bound points sit slightly above the slope. The slope is the
best of three bandwidth probes (triad, read and update), not a hard limit,
and a kernel with a lighter read/write mix can beat it. On one core
scaleis at 131% andgerat 124%. mixed/block_scaled_dot(i8 and f32) is above its ceiling at 118% on one core. Its roof is the f64 FMA peak, which an i8 kernel isn’t bound by.- Points far under the slope at an intensity near 0.06 are the elementwise
transcendentals (
sin,erf,log,exp,sqrt). The model counts one flop per element, but each costs tens of instructions, so they are compute- bound in fact and sit 7–21× under the slope on one core. - The compute-bound points other than level 3 sit far under the ceiling: at most a third of it, and the sparse direct solvers under 4%. These are the factorizations at 512×512, the dense eigensolvers at 256×256 and the sparse direct solvers. Their flop counts are nominal, and most of their time goes to panels, pivoting, iteration and indirect access, not to FMAs at full width.
blas3/gemm, 512×512×512, GFLOP/s and % of the measured FMA peak. The peak is
10.7 GFLOP/s per core in f64 (128-bit NEON, two FMA pipes, at 1344 MHz) and
64.3 GFLOP/s on six cores.
| native | native-fast | OpenBLAS | native-fast / OpenBLAS | |
|---|---|---|---|---|
| f64, 1 thread | 3.56 (33%) | 6.46 (60%) | 10.08 (94%) | 64% |
| f64, 6 threads | 11.73 (18%) | 32.44 (50%) | 55.58 (86%) | 58% |
| f32, 1 thread | 7.02 (33%) | 13.06 (61%) | 20.48 (96%) | 64% |
| f32, 6 threads | 20.91 (16%) | 65.07 (51%) | 107.46 (84%) | 61% |
- native-fast scales 5.0× on six cores, against OpenBLAS’s 5.5×. Its parallel decomposition holds up. The gap to OpenBLAS is the single-core kernel’s.
- The 1-thread figure matches the earlier A/B session. That session measured 6.7 GFLOP/s at 15 W and up to 1497.6 MHz (systems). This one measured 6.46 at 1344 MHz. The kernel reaches about the same fraction of the core either way.
- Mixed precision (
mixed/gemm, f32 inputs and f64 accumulation) reaches 4.19 GFLOP/s on one core in native-fast and 21.9 on six.
Memory-bound kernels and threading
Section titled “Memory-bound kernels and threading”| probe | 1 thread | 6 threads |
|---|---|---|
| bandwidth (the best of triad, read and update), GB/s | 16.1 | 35.0 |
gemv f64, native-fast, GFLOP/s (%roof) | 2.39 (59%) | 6.63 (76%) |
gemv f32, native-fast | 5.06 (63%) | 15.10 (86%) |
gemv f64, OpenBLAS | 2.66 (66%) | 7.27 (83%) |
A single A78AE can’t draw the module’s bandwidth, so the threaded memory-bound
kernels gain 2–3× here. That matters to a solver, because its inner loops are
spmv, dot and axpy. spmv gains 2.8× (94.7% of the 6-thread roof in
native-fast). The smoothers and the multigrid V-cycle gain nothing from six
threads (1.0–1.1×), so their %roof halves when the roof doubles.
Interleave width and #795
Section titled “Interleave width and #795”From Interleave width across the benchmark machines: GCC, one pinned core, n = 4096, median of 6 runs over both sessions, in ms.
| kernel | W=2 | W=4 | W=6 (default at the time) | fastest |
|---|---|---|---|---|
| gemv f64 | 13.60 | 12.89 | 19.94 | 4 |
| trmv f64 | 7.98 | 8.98 | 12.55 | 2 |
| trisolve f64 | 7.80 | 8.71 | 12.43 | 2 |
| gemv f32 | 13.21 | 7.74 | 12.24 | 4 |
| trmv f32 | 6.93 | 49.78 | 11.05 | 2 |
| trisolve f32 | 6.80 | 39.43 | 27.04 | 2 |
- W = 6 was 1.5–1.6× slower than the fastest width in every f64 kernel.
- The defaults of #798 gave W = 4 for f64 and f32
gemvand for f64trmvand forward substitution, and W = 2 for f32trmvand forward substitution under GCC. That leaves f64trmvand forward substitution 12% from their fastest width (W = 2). Run-time selection (#778) would recover it. - f32 at W = 4 is 7.2× slower than at W = 2 here (#795). The cause was the
keep_scalarbarrier, which was on for GCC on AArch64. Without it, in an A/B after these sessions (median of 3 runs), f32trmvtakes 6.31 ms at W = 4 against 50.04 with it, and the forward substitution 5.58 against 39.45. W = 4 is now their fastest width and the default;gemvkeeps the barrier, which is neutral here (8.23 against 8.34 ms).
Integer gemm: two modes at six threads (#785)
Section titled “Integer gemm: two modes at six threads (#785)”At six threads, two integer gemm entries run in one of two stable modes per process. The repetitions within one process agree to under 0.5%, but a new process can land in a mode 1.4–2× slower. The published session caught the slow mode of both:
| entry, 6 threads | session 1 | session 2 |
|---|---|---|
integer/gemm i16>i32 512³ | 7.09 ms | 14.07 ms |
integer/gemm i32 512³ | 9.00 ms | 12.79 ms |
Single-threaded, both are stable across the sessions. Clocks, temperature and session state were ruled out, and #785 lists the hypotheses: buffer placement, the uneven 512/6 row split, and false sharing on C. #785 is closed without a fix. Read a 6-thread integer gemm figure on this machine as one of two values.
Fixed since these sessions
Section titled “Fixed since these sessions”The quad integer gemm, read the wrong way round (#806). gemm_quad i8>i32,
the 4-way multiply-accumulate, is 3.9× faster than the plain i8 gemm in
native-fast (31.4 against 8.0 GOP/s on one core). This page used to call that
the emulated path, and the Ventuno’s reversal the native one. The sidecars say
the opposite: this build’s ISA is NEON DOTPROD, so its quad gemm is the
native SDOT path, and the Ventuno’s build was baseline Armv8.0-a, because GCC
13 under-detects that board. With its features named, the Ventuno’s quad gemm
is 4.5× its plain one
(Ventuno page).
Column-major gemv in native-fast (#804). In these sessions it
takes 50.1 ms on one core against 15.6 ms in the generic build and 12.9 ms in
OpenBLAS; the same gap appeared on every machine of the campaign. #809 fixed
the kernel’s traversal (see the
i7-12700K page). In
its A/B run on this machine (one core, n = 4096), f64 went from 63.92 to
17.78 ms and f32 from 31.40 to 7.93 ms, against 21.47 and 8.27 ms in the
generic build. The 2026-11-13 sessions confirm it: 12.9 ms in native-fast
against 16.3 ms in the generic build and 13.0 ms in OpenBLAS, f64, one core.
Sessions of 2026-11-13: #811 and CHOLMOD
Section titled “Sessions of 2026-11-13: #811 and CHOLMOD”Two more sessions, after SuiteSparse was installed, for the CHOLMOD reference entries of #810. The published card shows the second.
| Sessions | 20261113T131507Z and 20261113T140622Z, a cold boot before each |
| Commit | 967d20ac6b04, after #809 (column-major gemv), #811 (the thread pool) and #817 (the CHOLMOD 3 build) |
| Runs | as above, with CHOLMOD 3.0 (SuiteSparse 5.10) in the blas build; OpenBLAS 0.3.20 |
| Failed checks | 0. The 14 PARDISO entries are skipped: MKL is x86-only |
| Repeatability | 793 of 824 entries (96.2%) within ±5% between the two sessions; 27 of the 31 outliers are in the 6-thread runs |
-
#811 changes little here. native-fast
factor/luf64 512×512 takes 35.9 ms on one thread and 24.9 ms on six, against 35.3 and 26.0 ms on 2026-11-11. The #811 A/B measured 38.1 → 26.7 ms at six threads on this board, but the platform sessions never showed that slowdown: 26.0 ms on 2026-11-11 already. -
CHOLMOD’s factorization is 3.7–5.7× slower on six threads than on one. The 3D grid’s takes 79 ms on one thread and 295–453 ms on six. CHOLMOD 3 has no thread team of its own, so the threads are OpenBLAS’s. One diagnostic run on the idle board after the sessions, 3D factorization:
MTL5 pool OpenBLAS time 1 1 72 ms 6 6 299 ms 6 6, MTL5_THREAD_POOL_SPIN_US=0305 ms 6 1 72 ms 1 6 367 ms 1 2 58 ms MTL5’s pool and #811’s spin make no difference, and two OpenBLAS threads are faster than one. So it is OpenBLAS 0.3.20’s threading of CHOLMOD’s small dense updates on this board. The Ventuno’s OpenBLAS 0.3.26 gains 1.6× on four cores. Read the 6-thread
ref_cholmodfigures here as that effect, not as CHOLMOD’s. -
The direct solvers against CHOLMOD are on the direct-solver references page.
Caveats
Section titled “Caveats”- GCC 11 only. The AArch64 compiler comparison is on the Ventuno Q, which has both.
- The cards’ last-level cache is 2 MiB, one cluster’s L3. The 4 MiB system cache that sysfs doesn’t expose isn’t in the model.
- These are 25 W numbers. The module’s other power modes change both the clock cap and the online cores.
mediumclass sizes (512³ for dense level 3) are small for six threads. The cards aren’t a large-N scaling study.
Reproducing
Section titled “Reproducing”benchmarks/remote_session.sh <ssh-host> jetson-orin-platform.sh --reboot --interleavecmake -DRESULTS=build-platform/remote/jetson-orin/<session> -DMACHINE=jetson-orin \ -P benchmarks/publish_platform.cmakebenchmarks/plot_roofline.py benchmarks/data/jetson-orin/mtl5_bench/20261111T193624Z \ --out docs/img/benchmarks/jetson-orin/roofline-platform.svgbenchmarks/compare_sessions.py benchmarks/data/jetson-orin/mtl5_bench/20261111T190610Z \ benchmarks/data/jetson-orin/mtl5_bench/20261111T193624ZThe harness README gives the full session and
publishing steps. The raw results of both sessions are under
benchmarks/data/jetson-orin/mtl5_bench/.